

Question: 1 . ( ( mathbf { 2 5 } ) points ) Draw sample input and output graphs versus time and give
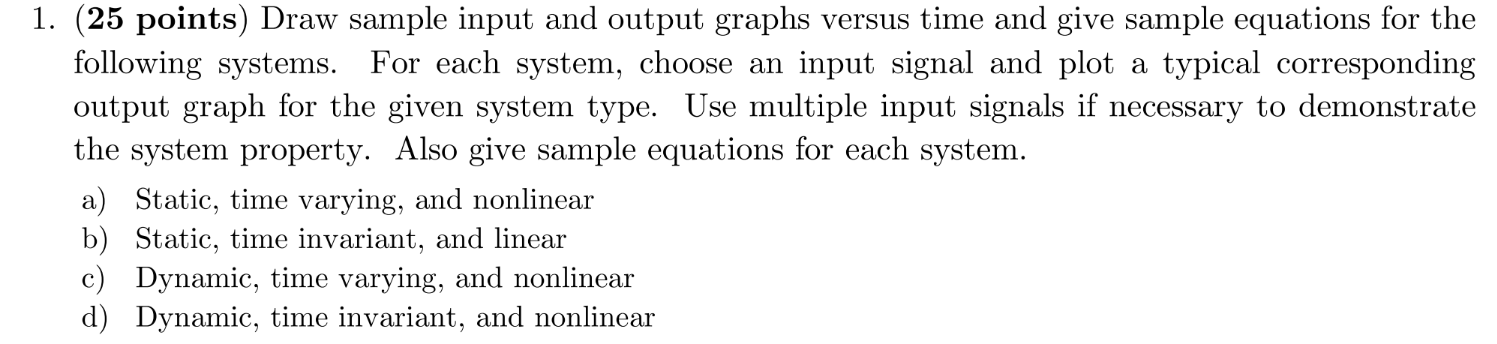
mathbf points Draw sample input and output graphs versus time and give sample equations for the following systems. For each system, choose an input signal and plot a typical corresponding output graph for the given system type. Use multiple input signals if necessary to demonstrate the system property. Also give sample equations for each system.
a Static, time varying, and nonlinear
b Static, time invariant, and linear
c Dynamic, time varying, and nonlinear
d Dynamic, time invariant, and nonlinear
Step by Step Solution
There are 3 Steps involved in it
1 Expert Approved Answer
Step: 1 Unlock

Question Has Been Solved by an Expert!
Get step-by-step solutions from verified subject matter experts
Step: 2 Unlock
Step: 3 Unlock