

Question: 1. [Maximum mark: 7] The graph of y = f(x) for -4 1. (Maximum mark: 71 The graph of y = f(x) for 4 x

1. [Maximum mark: 7] The graph of y = f(x) for -4
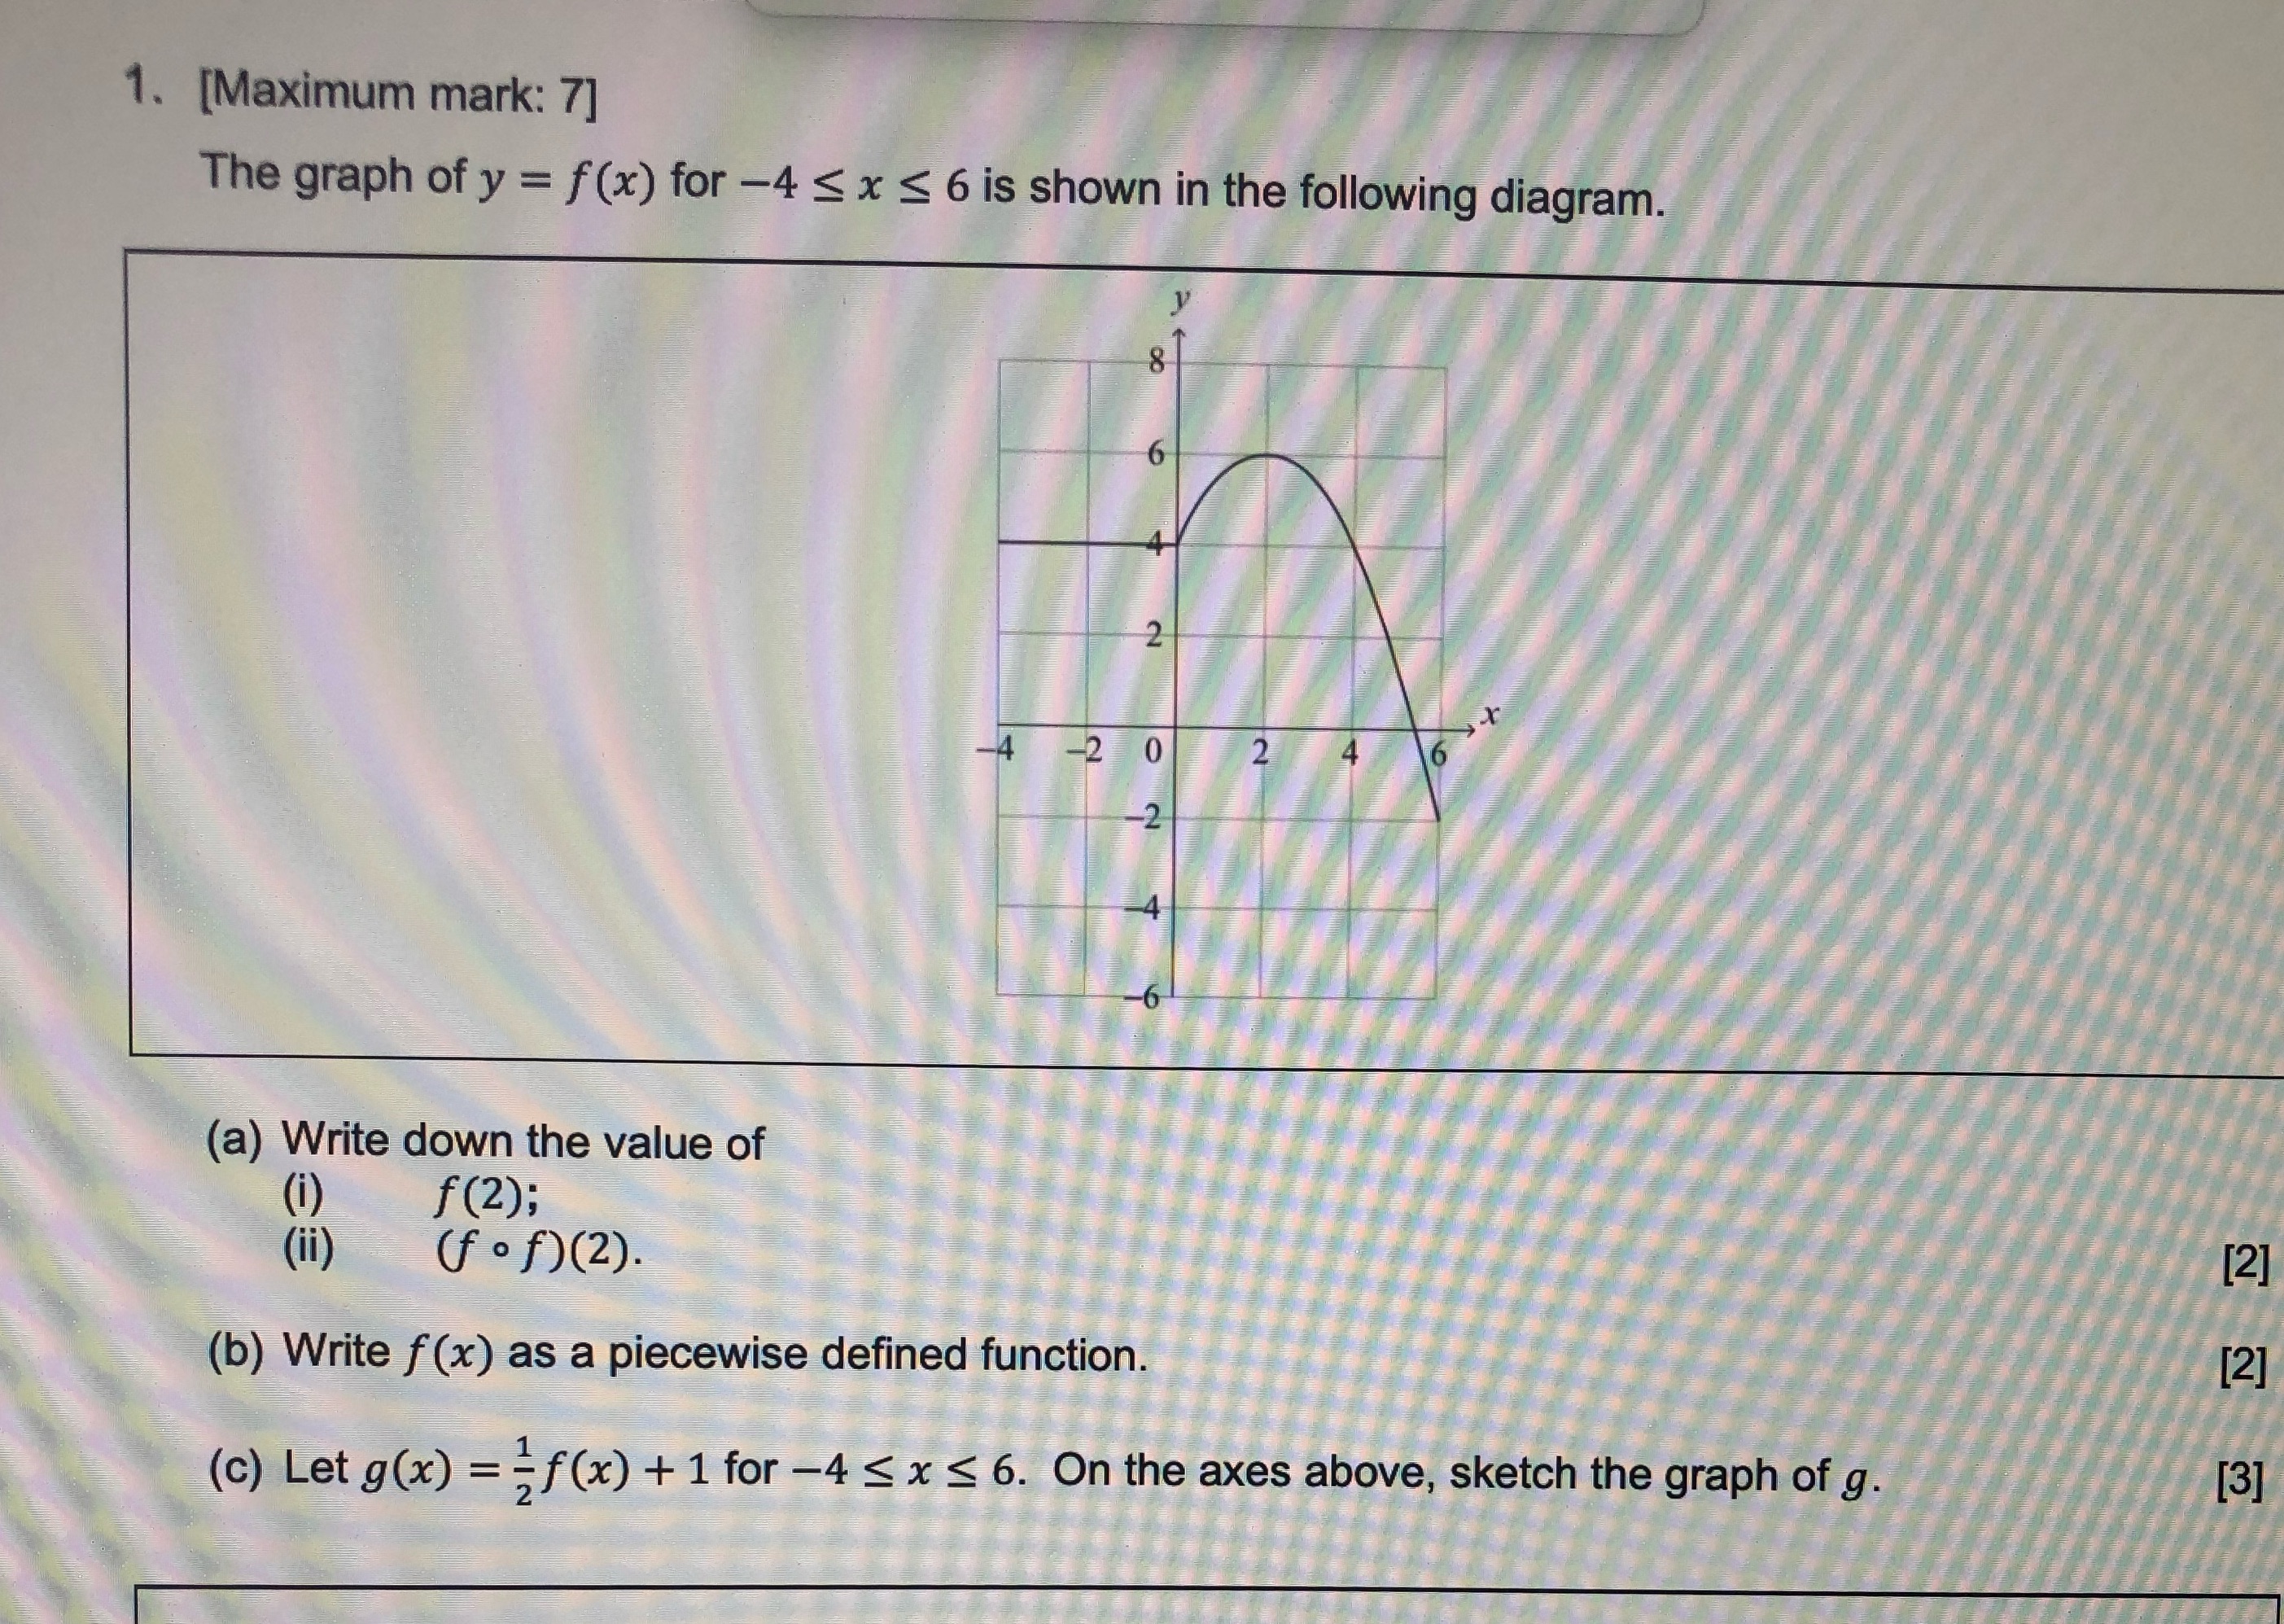
1. (Maximum mark: 71 The graph of y = f(x) for 4 x 6 is shown in the following diagram. 8 o 2 (a) Write down the value of (ii)V (f (b) Write f(x) as a piecewise defined function. 2 4 6 (c) Let g(x) = x 6. On the axes above, sketch the graph of g. [2] [2] [3]
Step by Step Solution
There are 3 Steps involved in it
1 Expert Approved Answer
Step: 1 Unlock

Question Has Been Solved by an Expert!
Get step-by-step solutions from verified subject matter experts
Step: 2 Unlock
Step: 3 Unlock