

Question: 1. Mean = 57 standard deviation = 13 Question 10 0.5 pts Z-scores to the left of the mean are positive, whereas z-scores to the
![x-values labelled on the graph below. [a]I [bl Ed} .4 . xvalues:](https://s3.amazonaws.com/si.experts.images/answers/2024/06/6668153c8f7a1_2126668153c773ab.jpg)
![8 3] l l percent: (a) lb) ' [Choose] ' [Choose] '](https://s3.amazonaws.com/si.experts.images/answers/2024/06/6668153cf30cd_2126668153cd2e86.jpg)
1.
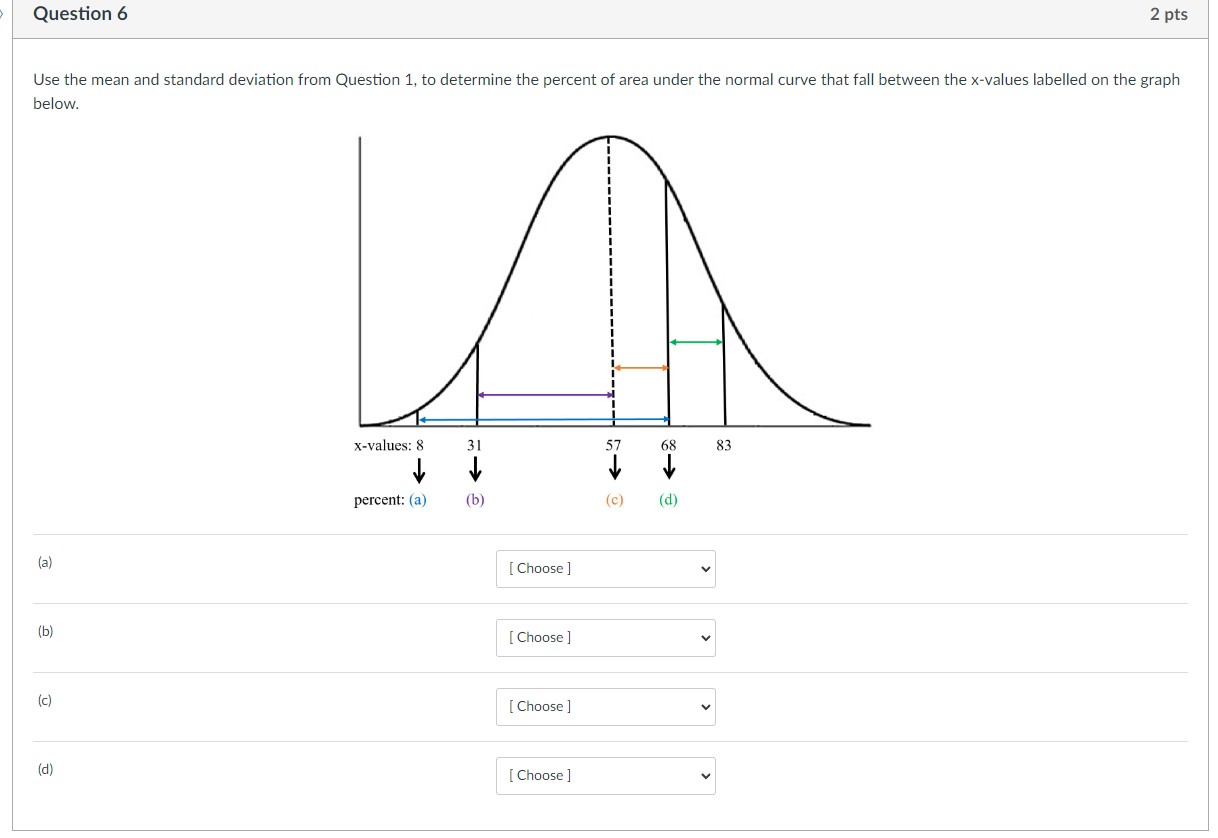
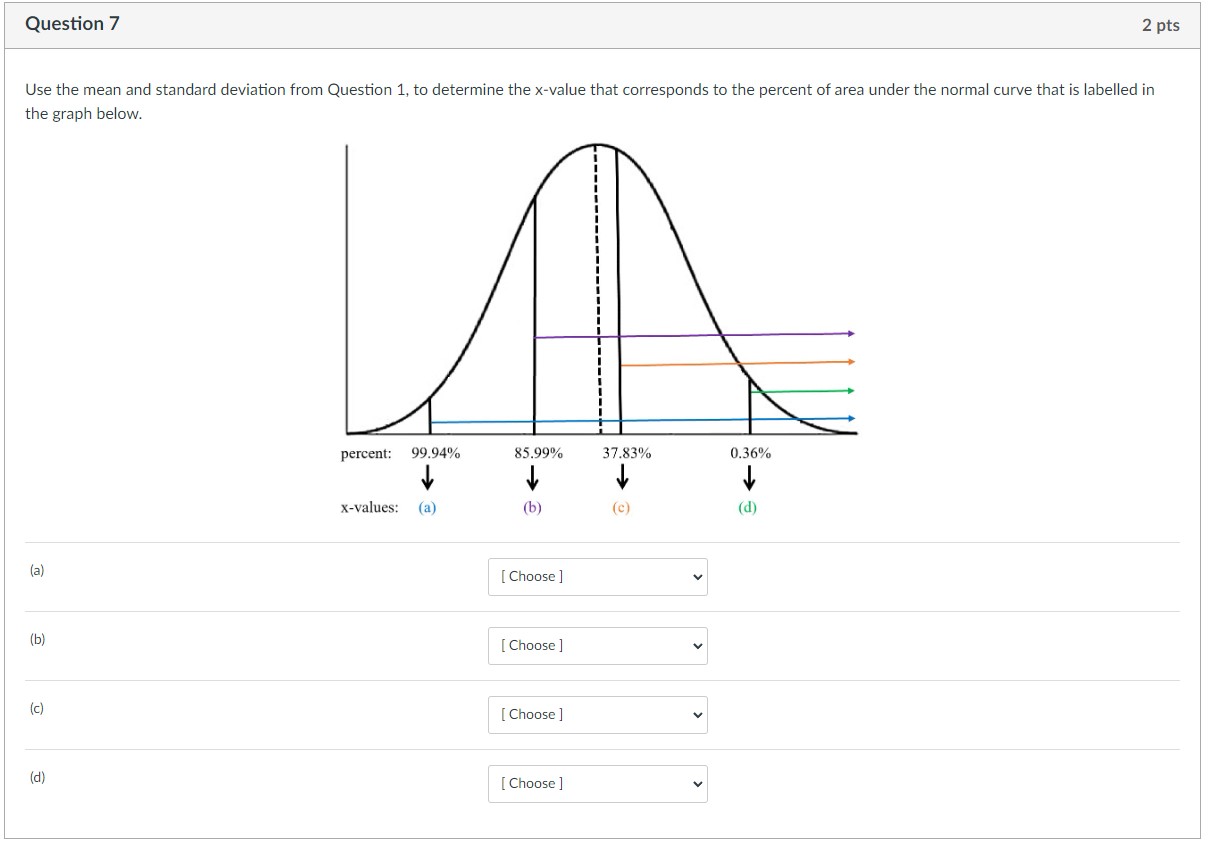
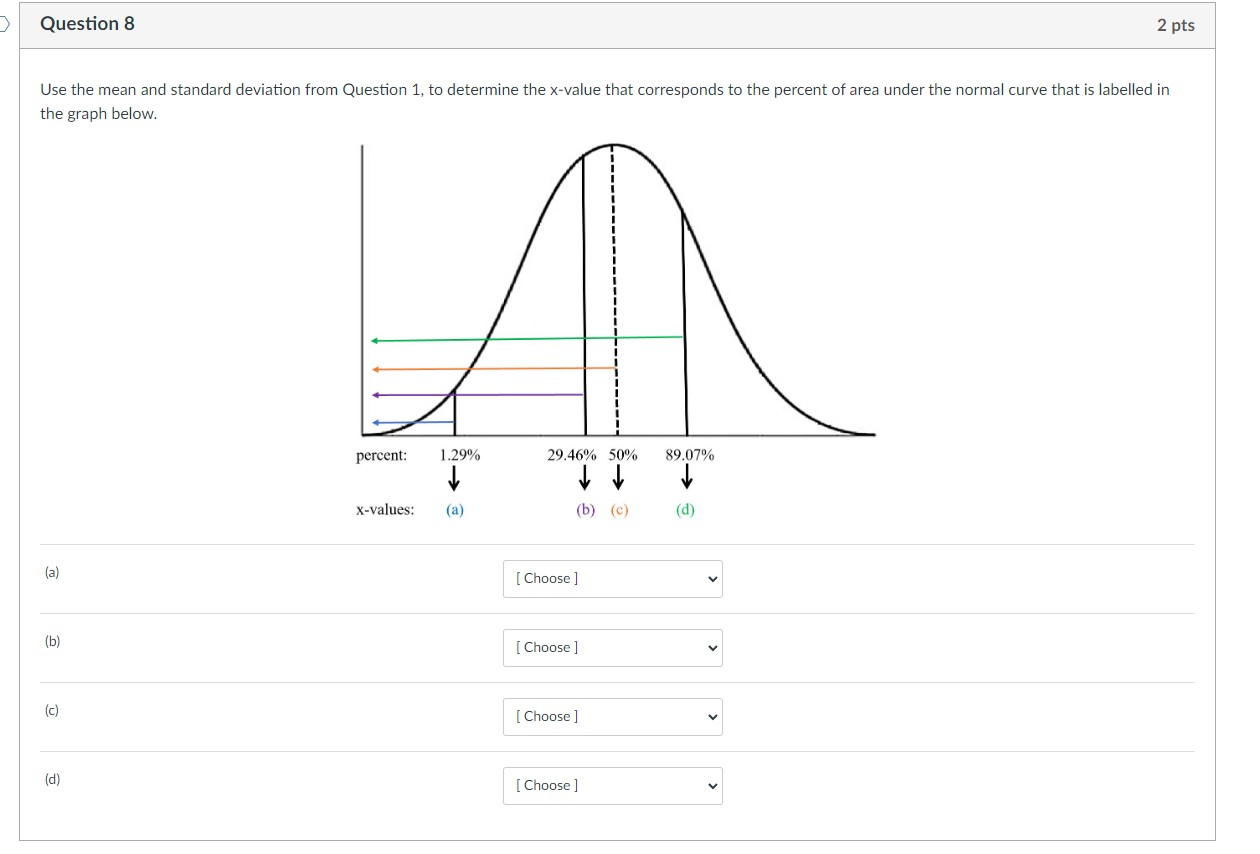
Mean = 57
standard deviation = 13
![[Choosve] ' [Choose] 5? 68 83 l l (C) (d) Question 7](https://s3.amazonaws.com/si.experts.images/answers/2024/06/6668153d576cf_2136668153d42d39.jpg)


![x-values: (a) (b) (c) (d) (a) [ Choose ] (b) [ Choose](https://s3.amazonaws.com/si.experts.images/answers/2024/06/6668153eb4cd2_2146668153e98ebd.jpg)
![] (c) [ Choose ] (d) [ Choose ]Question 8 2 pts](https://s3.amazonaws.com/si.experts.images/answers/2024/06/6668153f09aa3_2146668153ee7ce6.jpg)
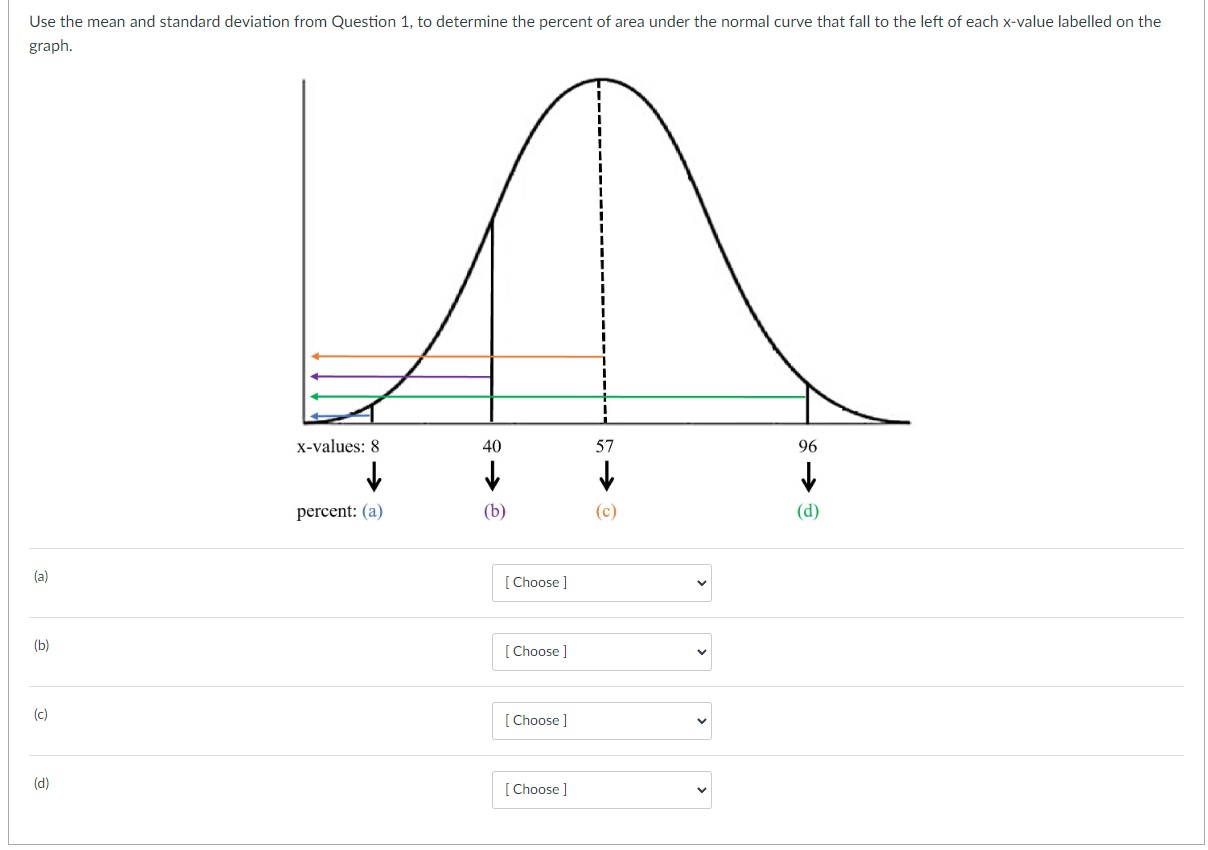
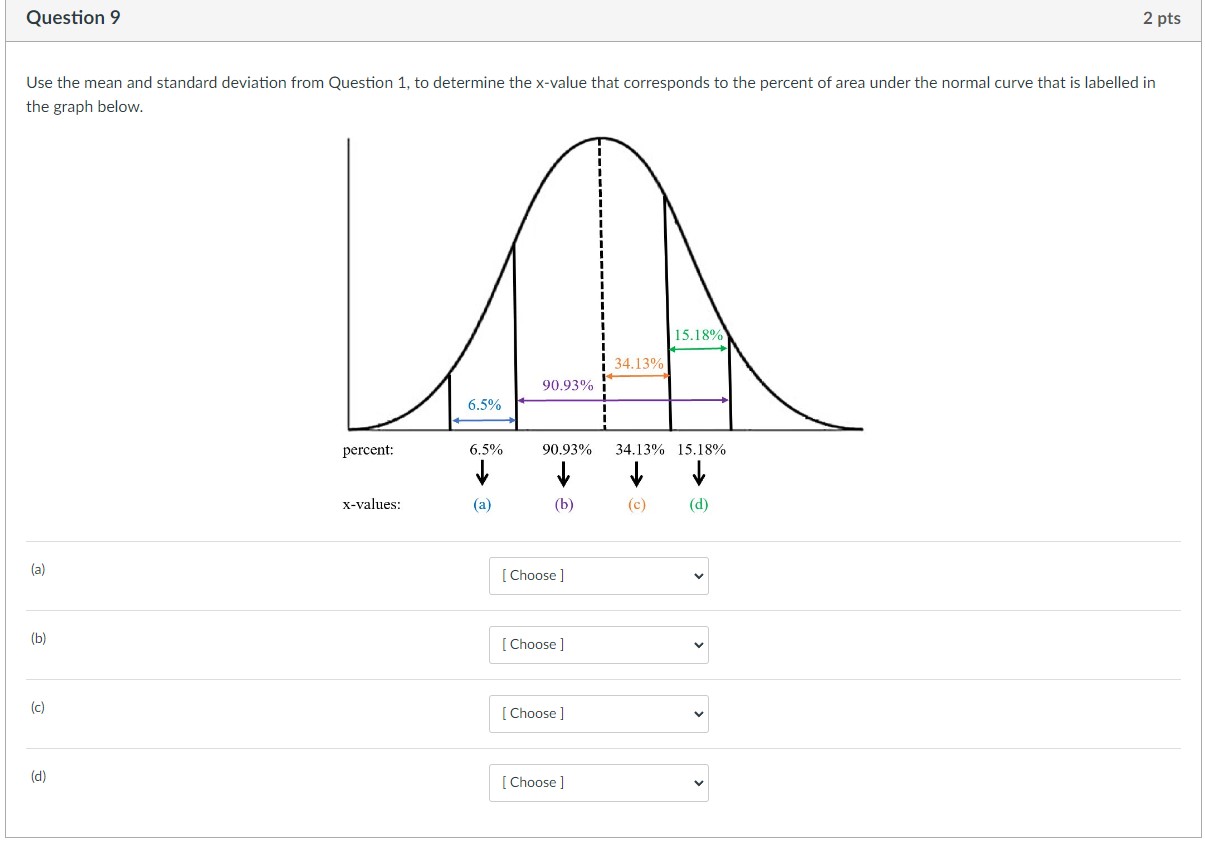
Question 10 0.5 pts Z-scores to the left of the mean are positive, whereas z-scores to the right of the mean are negative. O True O FalseQuestion 6 2 pts Use the mean and standard deviation from Question 1, to determine the percent of area under the normal curve that fall between the x-values labelled on the graph below. [a]I [bl Ed} .4 . xvalues: 8 3] l l percent: (a) lb) ' [Choose] ' [Choose] ' [Choosve] ' [Choose] 5? 68 83 l l (C) (d) Question 7 2 pts Use the mean and standard deviation from Question 1, to determine the x-value that corresponds to the percent of area under the normal curve that is labelled in the graph below. 37.83% 0.36% V x-values: (a) (b) (c) (d) (a) [ Choose ] (b) [ Choose ] (c) [ Choose ] (d) [ Choose ]Question 8 2 pts Use the mean and standard deviation from Question 1, to determine the x-value that corresponds to the percent of area under the normal curve that is labelled in the graph below. percent: 1.29% 29.46% 50% 89.07% X-values: (a) (b) (c ) (d) (a) [ Choose ] (b) [ Choose ] (c) [ Choose ] (d) [ Choose ]Question 9 2 pts Use the mean and standard deviation from Question 1, to determine the x-value that corresponds to the percent of area under the normal curve that is labelled in the graph below. 15.18% 34.13% 90.93% 6.5% percent: 6.5% 90.93% 34.13% 15.18% x-values: (a) (b) (c) (d) (a) [ Choose ] (b) [ Choose ] (c) [ Choose ] (d) [ Choose ]Question 4 2 pts Use the mean and standard deviation from Question 1, to determine the percent of area under the normal curve that fall to the right of each x-value labeiled on the graph. (a) {b} Ed} ' [Choose] ' [Choose] ' [Choose] ' [Choose] Use the mean and standard deviation from Question 1, to determine the percent of area under the normal curve that fall to the left of each x-value labelled on the graph. x-values: s 40 57 96 percent: (ll (lb) (ll) (ill) Ea) 'ri [bl if} [c] l [Choose] v Ed} ' [Choose] VI
Step by Step Solution
There are 3 Steps involved in it

Get step-by-step solutions from verified subject matter experts