

Question: 1. Measurement Practice Problem 1 (a) - 1 (c). Download quarterly, seasonally adjusted data on U.S. real GDP (Billions of Chained 2012 dollars) for the
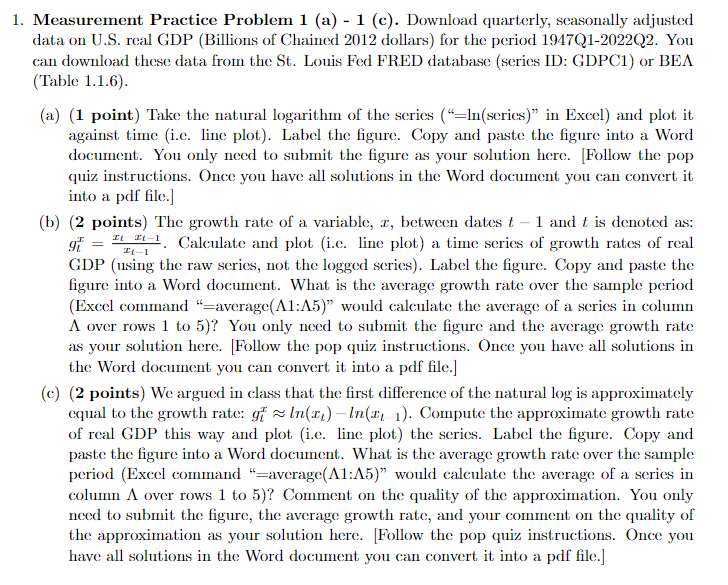

1. Measurement Practice Problem 1 (a) - 1 (c). Download quarterly, seasonally adjusted data on U.S. real GDP (Billions of Chained 2012 dollars) for the period 1947Q1-2022Q2. You can download these data from the St. Louis Fed FRED database (series ID: GDPC1) or BEA (Table 1.1.6). (a) (1 point) Take the natural logarithm of the series ("=In(series)" in Excel) and plot it against time (i.c. line plot). Label the figure. Copy and paste the figure into a Word document. You only need to submit the figure as your solution here. [Follow the pop quiz instructions. Once you have all solutions in the Word document you can convert it into a pdf file.] (b) (2 points) The growth rate of a variable, a, between dates t - 1 and t is denoted as: gi = = It-1 It 2-1. Calculate and plot (i.e. line plot) a time series of growth rates of real GDP (using the raw series, not the logged series). Label the figure. Copy and paste the figure into a Word document. What is the average growth rate over the sample period (Excel command "average(A1:A5)" would calculate the average of a series in column A over rows 1 to 5)? You only need to submit the figure and the average growth rate as your solution here. Follow the pop quiz instructions. Once you have all solutions in the Word document you can convert it into a pdf file.] (c) (2 points) We argued in class that the first difference of the natural log is approximately equal to the growth rate: of = In(a;)-In(2, 1). Compute the approximate growth rate of real GDP this way and plot (i.c. line plot) the series. Label the figure. Copy and paste the figure into a Word document. What is the average growth rate over the sample period (Excel command "=average(A1:A5)" would calculate the average of a series in column A over rows 1 to 5)? Comment on the quality of the approximation. You only need to submit the figure, the average growth rate, and your comment on the quality of the approximation as your solution here. [Follow the pop quiz instructions. Once you have all solutions in the Word document you can convert it into a pdf file.]
Step by Step Solution
There are 3 Steps involved in it

Get step-by-step solutions from verified subject matter experts