

Question: 1. Measuring stand-alone risk using realized (historical) data Returns earned over a given time period are called realized returns. Historical data on realized returns is
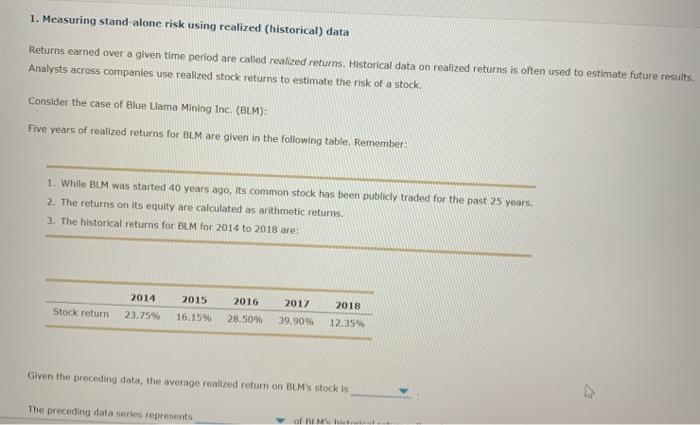
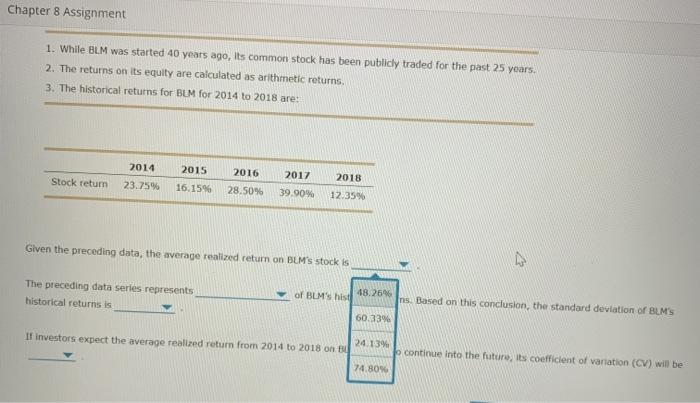
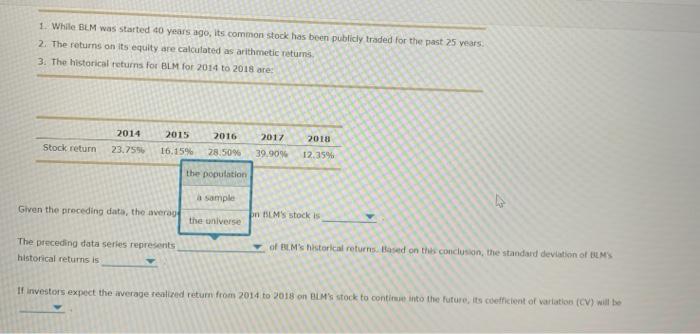
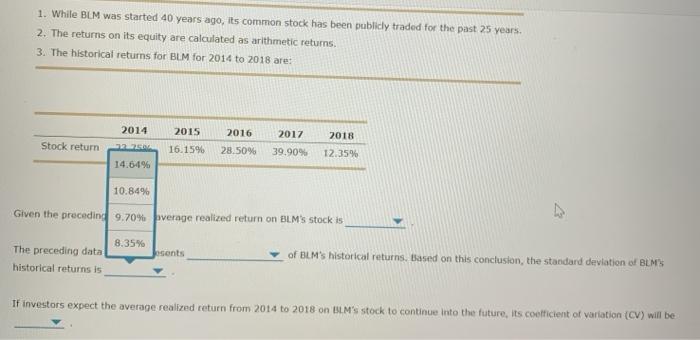
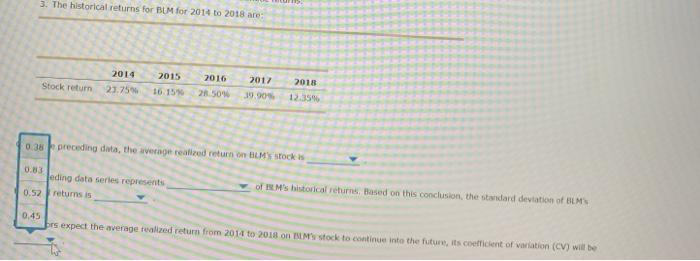
1. Measuring stand-alone risk using realized (historical) data Returns earned over a given time period are called realized returns. Historical data on realized returns is often used to estimate future results. Analysts across companies use realized stock returns to estimate the risk of a stock. Consider the case of Blue Ulama Mining Inc. (BLM): Five years of realized returns for BLM are given in the following table. Remember: 1. While BLM was started 40 years ago, its common stock has been publicly traded for the past 25 years. 2. The returns on its equity are calculated as arithmetic returns 3. The historical returns for BLM for 2014 to 2018 are: 2014 Stock return 2015 16.15% 23.75% 2016 28.50% 2017 39.90% 2018 12.35 Given the preceding data, the average realized return on BLM's stock is The preceding data series represents of HIM Chapter 8 Assignment 1. While BLM was started 40 years ago, its common stock has been publicly traded for the past 25 years. 2. The returns on its equity are calculated as arithmetic returns. 3. The historical returns for BUM for 2014 to 2018 are: 2014 2015 Stock return 23.75% 2016 28.50% 16.15% 2017 39.90% 2018 12.35% Given the preceding data, the average realized return on BLM's stock is D The preceding data series represents historical returns is 48.2696 of BLM's hist Ins. Based on this conclusion, the standard deviation of BUM'S 60.33% If investors expect the average realized return from 2014 to 2018 on Bu 24.13% o continue Into the future, its coefficient of variation (CV) will be 74.809 1. While BLM was started 40 years ago, its common stock has been publicly traded for the past 25 years. 2. The returns on its equity are calculated as arithmetic returns 3. The historical returns for BLM for 2014 to 2018 are: 2014 23.755 2018 Stock return 2015 16.15% 2016 28.50% 2017 39.90% 12.35% the population sample Given the preceding data, the average SMS stock is the universe The preceding data series represents historical returns is of BM's historical returns. Based on this conclusion, the standard deviation of BMS If investors expect the average realized return from 2014 to 2018 on BLM's stock to contine into the future, its coefficient of variation (CV) will be 1. While BLM was started 40 years ago, its common stock has been publicly traded for the past 25 years. 2. The returns on its equity are calculated as arithmetic returns 3. The historical returns for BLM for 2014 to 2018 are: 2014 2015 Stock return 2016 28.50% 2017 39.90% 16.1596 2018 12.35% 14.64% 10.84% Given the preceding 9.70% average realized return on BLM's stock is 8.35% osents The preceding data historical returns is of BLM's historical returns. Based on this conclusion, the standard deviation of BLM's If investors expect the average realized return from 2014 to 2018 on SL.M's stock to continue into the future, its coefficient of variation (CV) will be 3. The historical returns for BUM for 2014 to 2018 are: Stock return 2014 23.754 2015 16.15 2016 250 2017 39.90 2018 12:35 0.38 preceding data, the average realized return on My Stock 0.83 Jeding data series represents 0.52 returns is of PM's historical returns. Based on this conclusion, the standard deviation of BMS 0.45 bis expect the average realized return from 2014 to 2018 on M's stock to continue into the future, its coefficient of variation (CV) will be
Step by Step Solution
There are 3 Steps involved in it

Get step-by-step solutions from verified subject matter experts