

Question: 1 MIS 6 3 3 5 Python for Analytics Homework 6 Working with Dates HERE IS WHAT I WANT YOU TO DO: Your assigned task
MIS Python for Analytics
Homework Working with Dates
HERE IS WHAT I WANT YOU TO DO:
Your assigned task is to complete the data operations described below using pandas, Python, and the Jupyter Notebook. The data file for this assignment is named IBMcsv and is available on Blackboard with the other course data. Submit your completed notebook at the appropriate link in Blackboard. Do not submit the data file.
HERE IS WHY I WANT YOU TO DO IT:
In addition to the skills we have practiced to this point, this assignment will give you more experience with the following:
reading csv files containing date data
using resampling
using the plot function built into the dataframe object
HERE IS HOW TO DO IT:
Use your template notebook as a basis to create the welldocumented code to show the results of the analysis described below.
This dataset contains all daily stock data for IBM stock trading symbol is wait for it IBM since January
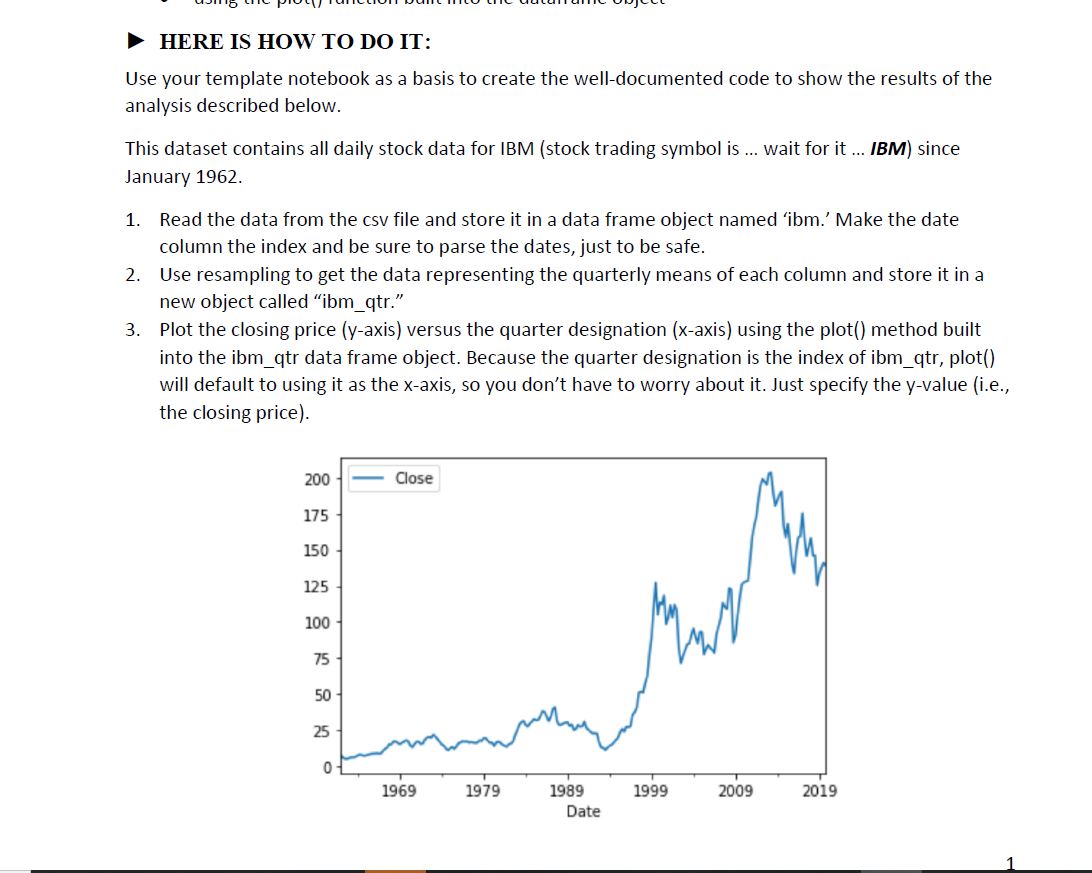
Read the data from the csv file and store it in a data frame object named ibm Make the date column the index and be sure to parse the dates, just to be safe.
Use resampling to get the data representing the quarterly means of each column and store it in a new object called ibmqtr
Plot the closing price yaxis versus the quarter designation xaxis using the plot method built into the ibmqtr data frame object. Because the quarter designation is the index of ibmqtr plot will default to using it as the xaxis, so you dont have to worry about it Just specify the yvalue ie the closing price
Use resampling to get another set of data representing the weekly totals of each column and save it in a new object called ibmwk
Inside print statements, use the dataframe methods nsmallest and nlargest to display the smallest and largest volume weeks in ibmwk
HERE IS WHAT NOT TO WORRY ABOUT:
There is nothing obvious to add here. Ask if you have a question.
Solve the problems before you start writing code. HERE IS HOW TO DO IT:
Use your template notebook as a basis to create the welldocumented code to show the results of the analysis described below.
This dataset contains all daily stock data for IBM stock trading symbol is wait for it IBM since January
Read the data from the csv file and store it in a data frame object named 'ibm. Make the date column the index and be sure to parse the dates, just to be safe.
Use resampling to get the data representing the quarterly means of each column and store it in a new object called "ibmqtr
Plot the closing price y axis versus the quarter designation x axis using the plot method built into the ibmqtr data frame object. Because the quarter designation is the index of ibmqtr plot will default to using it as the x axis, so you don't have to worry about it Just specify the y value ie the closing price Use resampling to get another set of data representing the weekly totals of each column and save it in a new object called "ibmwk
Inside print statements, use the dataframe methods "nsmallest" and "nlargest" to display the smallest and largest volume weeks in ibmwk
HERE IS WHAT NOT TO WORRY ABOUT:
There is nothing obvious to add here. Ask if you have a question.
Step by Step Solution
There are 3 Steps involved in it
1 Expert Approved Answer
Step: 1 Unlock

Question Has Been Solved by an Expert!
Get step-by-step solutions from verified subject matter experts
Step: 2 Unlock
Step: 3 Unlock