

Question: 1. Monte Carlo Simulation Use the Assignment MC Simulation data set. B&R Oil & Gas Ltd. stock is listed on the NASDAQ stock exchange currently
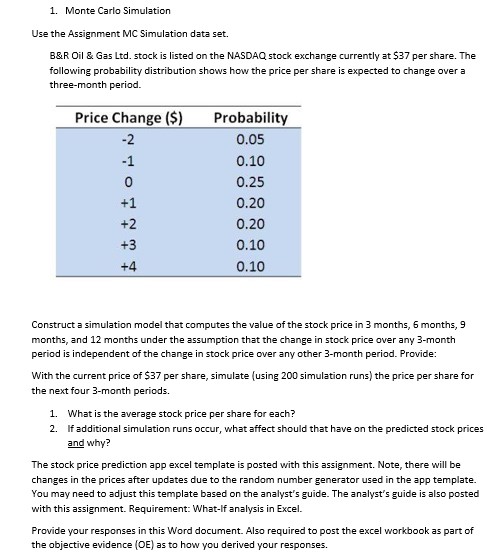
1. Monte Carlo Simulation Use the Assignment MC Simulation data set. B&R Oil & Gas Ltd. stock is listed on the NASDAQ stock exchange currently at $37 per share. The following probability distribution shows how the price per share is expected to change over a three-month period. Price Change ($) Probability 0.05 0.10 0.25 +1 0.20 +2 0.20 0.10 +4 0.10 Construct a simulation model that computes the value of the stock price in 3 months, 6 months, 9 months, and 12 months under the assumption that the change in stock price over any 3-month period is independent of the change in stock price over any other 3-month period. Provide: With the current price of $37 per share, simulate (using 200 simulation runs) the price per share for the next four 3-month periods. 1. What is the average stock price per share for each? 2. If additional simulation runs occur, what affect should that have on the predicted stock prices and why? The stock price prediction app excel template is posted with this assignment. Note, there will be changes in the prices after updates due to the random number generator used in the app template. You may need to adjust this template based on the analyst's guide. The analyst's guide is also posted with this assignment. Requirement: What-If analysis in Excel. Provide your responses in this Word document. Also required to post the excel workbook as part of the objective evidence (OE) as to how you derived your responses
Step by Step Solution
There are 3 Steps involved in it

Get step-by-step solutions from verified subject matter experts