

Question: n Given the acceleration pattern shown in Figure 2.1 below, (a) derive and plot the relationship between speed and time and (b) calculate the total
 n
n
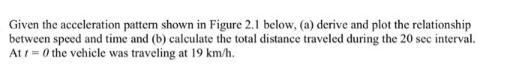
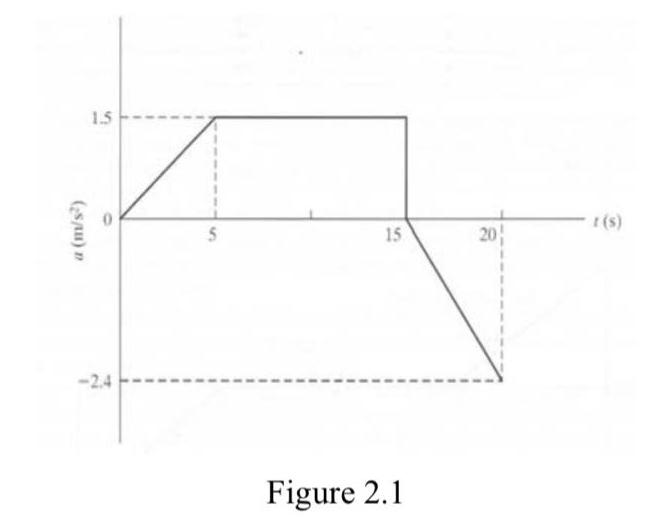
Given the acceleration pattern shown in Figure 2.1 below, (a) derive and plot the relationship between speed and time and (b) calculate the total distance traveled during the 20 sec interval. Atr=0 the vehicle was traveling at 19 km/h. (sau) D 1.5 0 -2.4 15 Figure 2.1 20
Step by Step Solution
There are 3 Steps involved in it
1 Expert Approved Answer
Step: 1 Unlock

a Relationship between speed and time Given Acceleration pattern from Fig 21 Initial speed at t0 is ... View full answer
Question Has Been Solved by an Expert!
Get step-by-step solutions from verified subject matter experts
Step: 2 Unlock
Step: 3 Unlock