

Question: 1. No explanations needed, only correct solutions: Use the t-distribution table to find the critical value(s) for the indicated alternative hypotheses, level of significance a,
1. No explanations needed, only correct solutions:
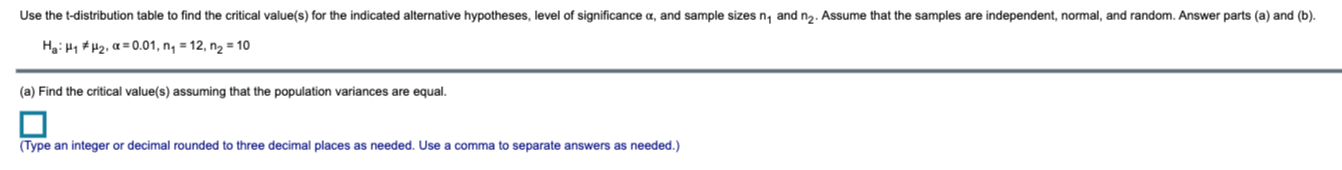
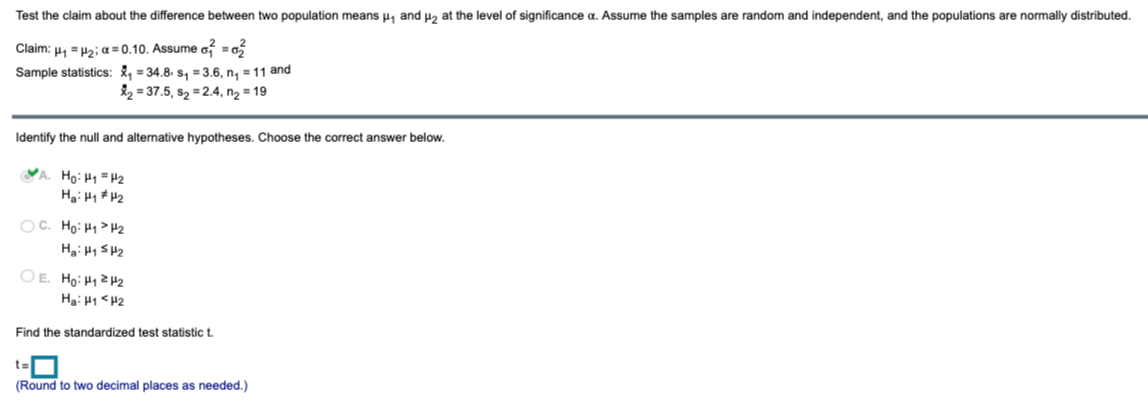
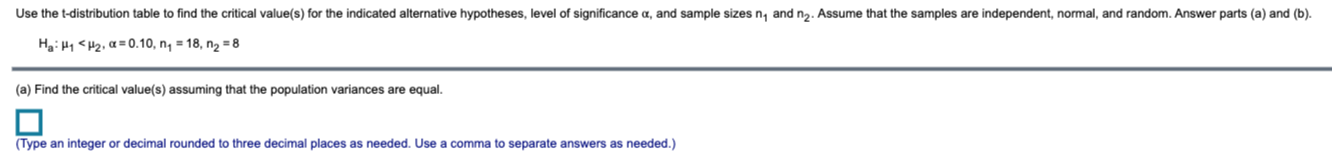
Use the t-distribution table to find the critical value(s) for the indicated alternative hypotheses, level of significance a, and sample sizes n, and n2. Assume that the samples are independent, normal, and random. Answer parts (a) and (b). Ha: My # H2, a = 0.01, n, = 12, n2 = 10 (a) Find the critical value(s) assuming that the population variances are equal. Type an integer or decimal rounded to three decimal places as needed. Use a comma to separate answers as needed.)Test the claim about the difference between two population means u, and u2 at the level of significance a. Assume the samples are random and independent, and the populations are normally distributed. Claim: H1 = H2: a = 0.10. Assume of =02 Sample statistics: , = 34.8. s, = 3.6, n, = 11 and *2 = 37.5, $2 = 2.4, n2 = 19 Identify the null and alternative hypotheses. Choose the correct answer below. JA. Ho: H1 = H2 Ha: H1 # H2 OC. Ho: H1 > H2 Ha: Hi S H2 OF. HO: H1 2 H2 Ha: H1
Step by Step Solution
There are 3 Steps involved in it

Get step-by-step solutions from verified subject matter experts