

Question: 1 Normal I No Spac... Heading 1 Heading Font Paragraph Styles You have been given the following return data on three assets F, G, and
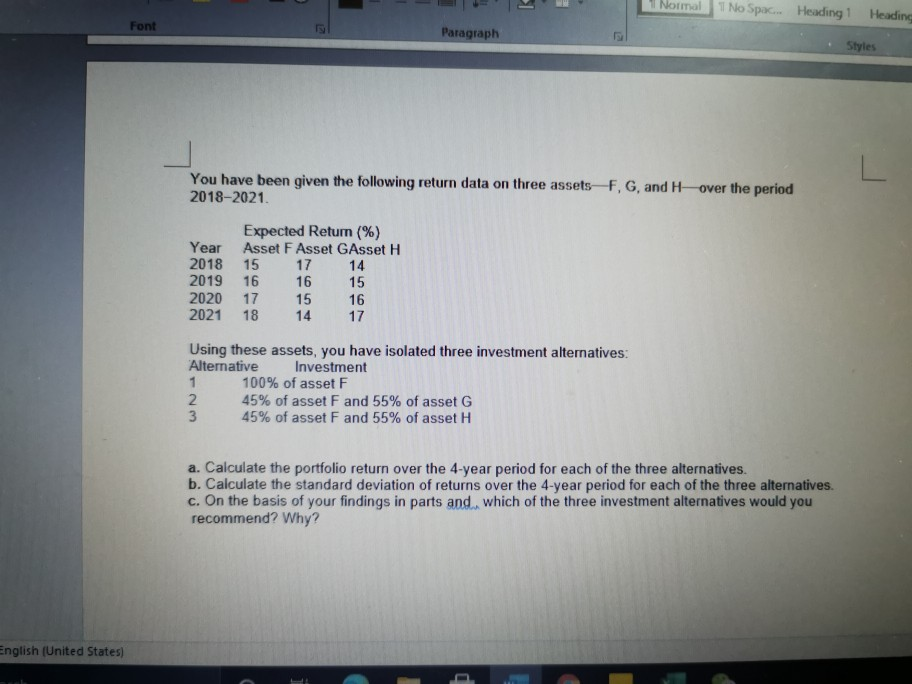
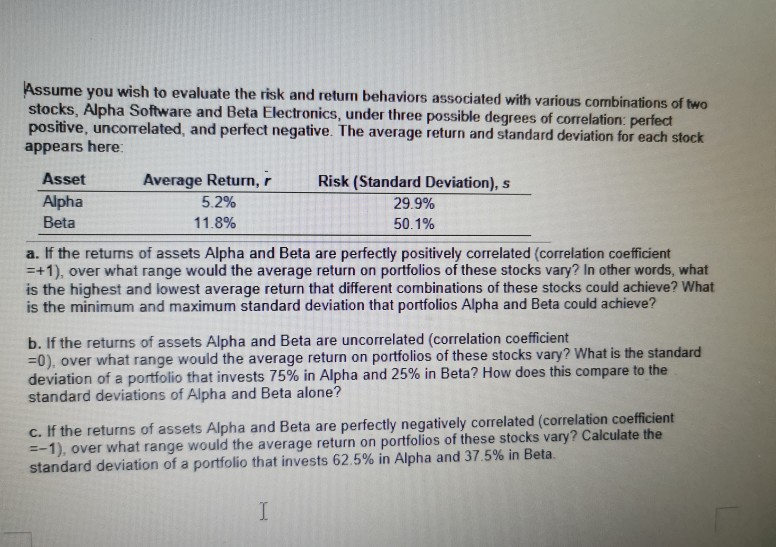
1 Normal I No Spac... Heading 1 Heading Font Paragraph Styles You have been given the following return data on three assets F, G, and over the period 2018-2021. Year 2018 2019 2020 2021 Expected Return (%) Asset F Asset GAsset H 15 17 14 16 16 15 17 15 16 18 14 17 Using these assets, you have isolated three investment alternatives: Alternative Investment 100% of asset F 2 45% of asset F and 55% of asset G 3 45% of asset F and 55% of asset H a. Calculate the portfolio return over the 4-year period for each of the three alternatives. b. Calculate the standard deviation of returns over the 4-year period for each of the three alternatives. c. On the basis of your findings in parts and, which of the three investment alternatives would you recommend? Why? English (United States) Assume you wish to evaluate the risk and return behaviors associated with various combinations of two stocks, Alpha Software and Beta Electronics, under three possible degrees of correlation perfect positive, uncorrelated, and perfect negative. The average return and standard deviation for each stock appears here: Asset Average Return, Risk (Standard Deviation), s Alpha 5.2% 29.9% Beta 11.8% 50.1% a. If the retums of assets Alpha and Beta are perfectly positively correlated (correlation coefficient =+1), over what range would the average return on portfolios of these stocks vary? In other words, what is the highest and lowest average return that different combinations of these stocks could achieve? What is the minimum and maximum standard deviation that portfolios Alpha and Beta could achieve? b. If the returns of assets Alpha and Beta are uncorrelated (correlation coefficient =0), over what range would the average return on portfolios of these stocks vary? What is the standard deviation of a portfolio that invests 75% in Alpha and 25% in Beta? How does this compare to the standard deviations of Alpha and Beta alone? c. If the returns of assets Alpha and Beta are perfectly negatively correlated (correlation coefficient =-1), over what range would the average return on portfolios of these stocks vary? Calculate the standard deviation of a portfolio that invests 62.5% in Alpha and 37.5% in Beta
Step by Step Solution
There are 3 Steps involved in it

Get step-by-step solutions from verified subject matter experts