

Question: 1. Normalize Figure 10.9. Sample Value 3 Sue Rogers Attribute Name StudentlD StudentName CourselD CourseName Grade CourseDate Sample Value 1 John Smith Sample Value 2
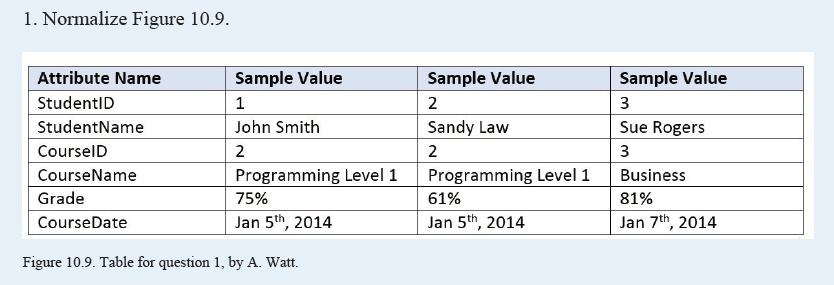
1. Normalize Figure 10.9. Sample Value 3 Sue Rogers Attribute Name StudentlD StudentName CourselD CourseName Grade CourseDate Sample Value 1 John Smith Sample Value 2 Sandy Law Programming Level 1 Programming Level 1 Business 75% Jan 5th, 2014 61% Jan 5th, 2014 81% Jan 7th, 2014 Figure 109. Table for question 1, by A. Watt
Step by Step Solution
There are 3 Steps involved in it
1 Expert Approved Answer
Step: 1 Unlock

Question Has Been Solved by an Expert!
Get step-by-step solutions from verified subject matter experts
Step: 2 Unlock
Step: 3 Unlock