

Question: 1. Obtain the summary statistics for each variable, and ll the table below. See R Script for instructions. [2 marks] Y = 24 285 1193
![table below. See R Script for instructions. [2 marks] Y = 24](https://s3.amazonaws.com/si.experts.images/answers/2024/06/666df65f1c969_526666df65ee99d0.jpg)
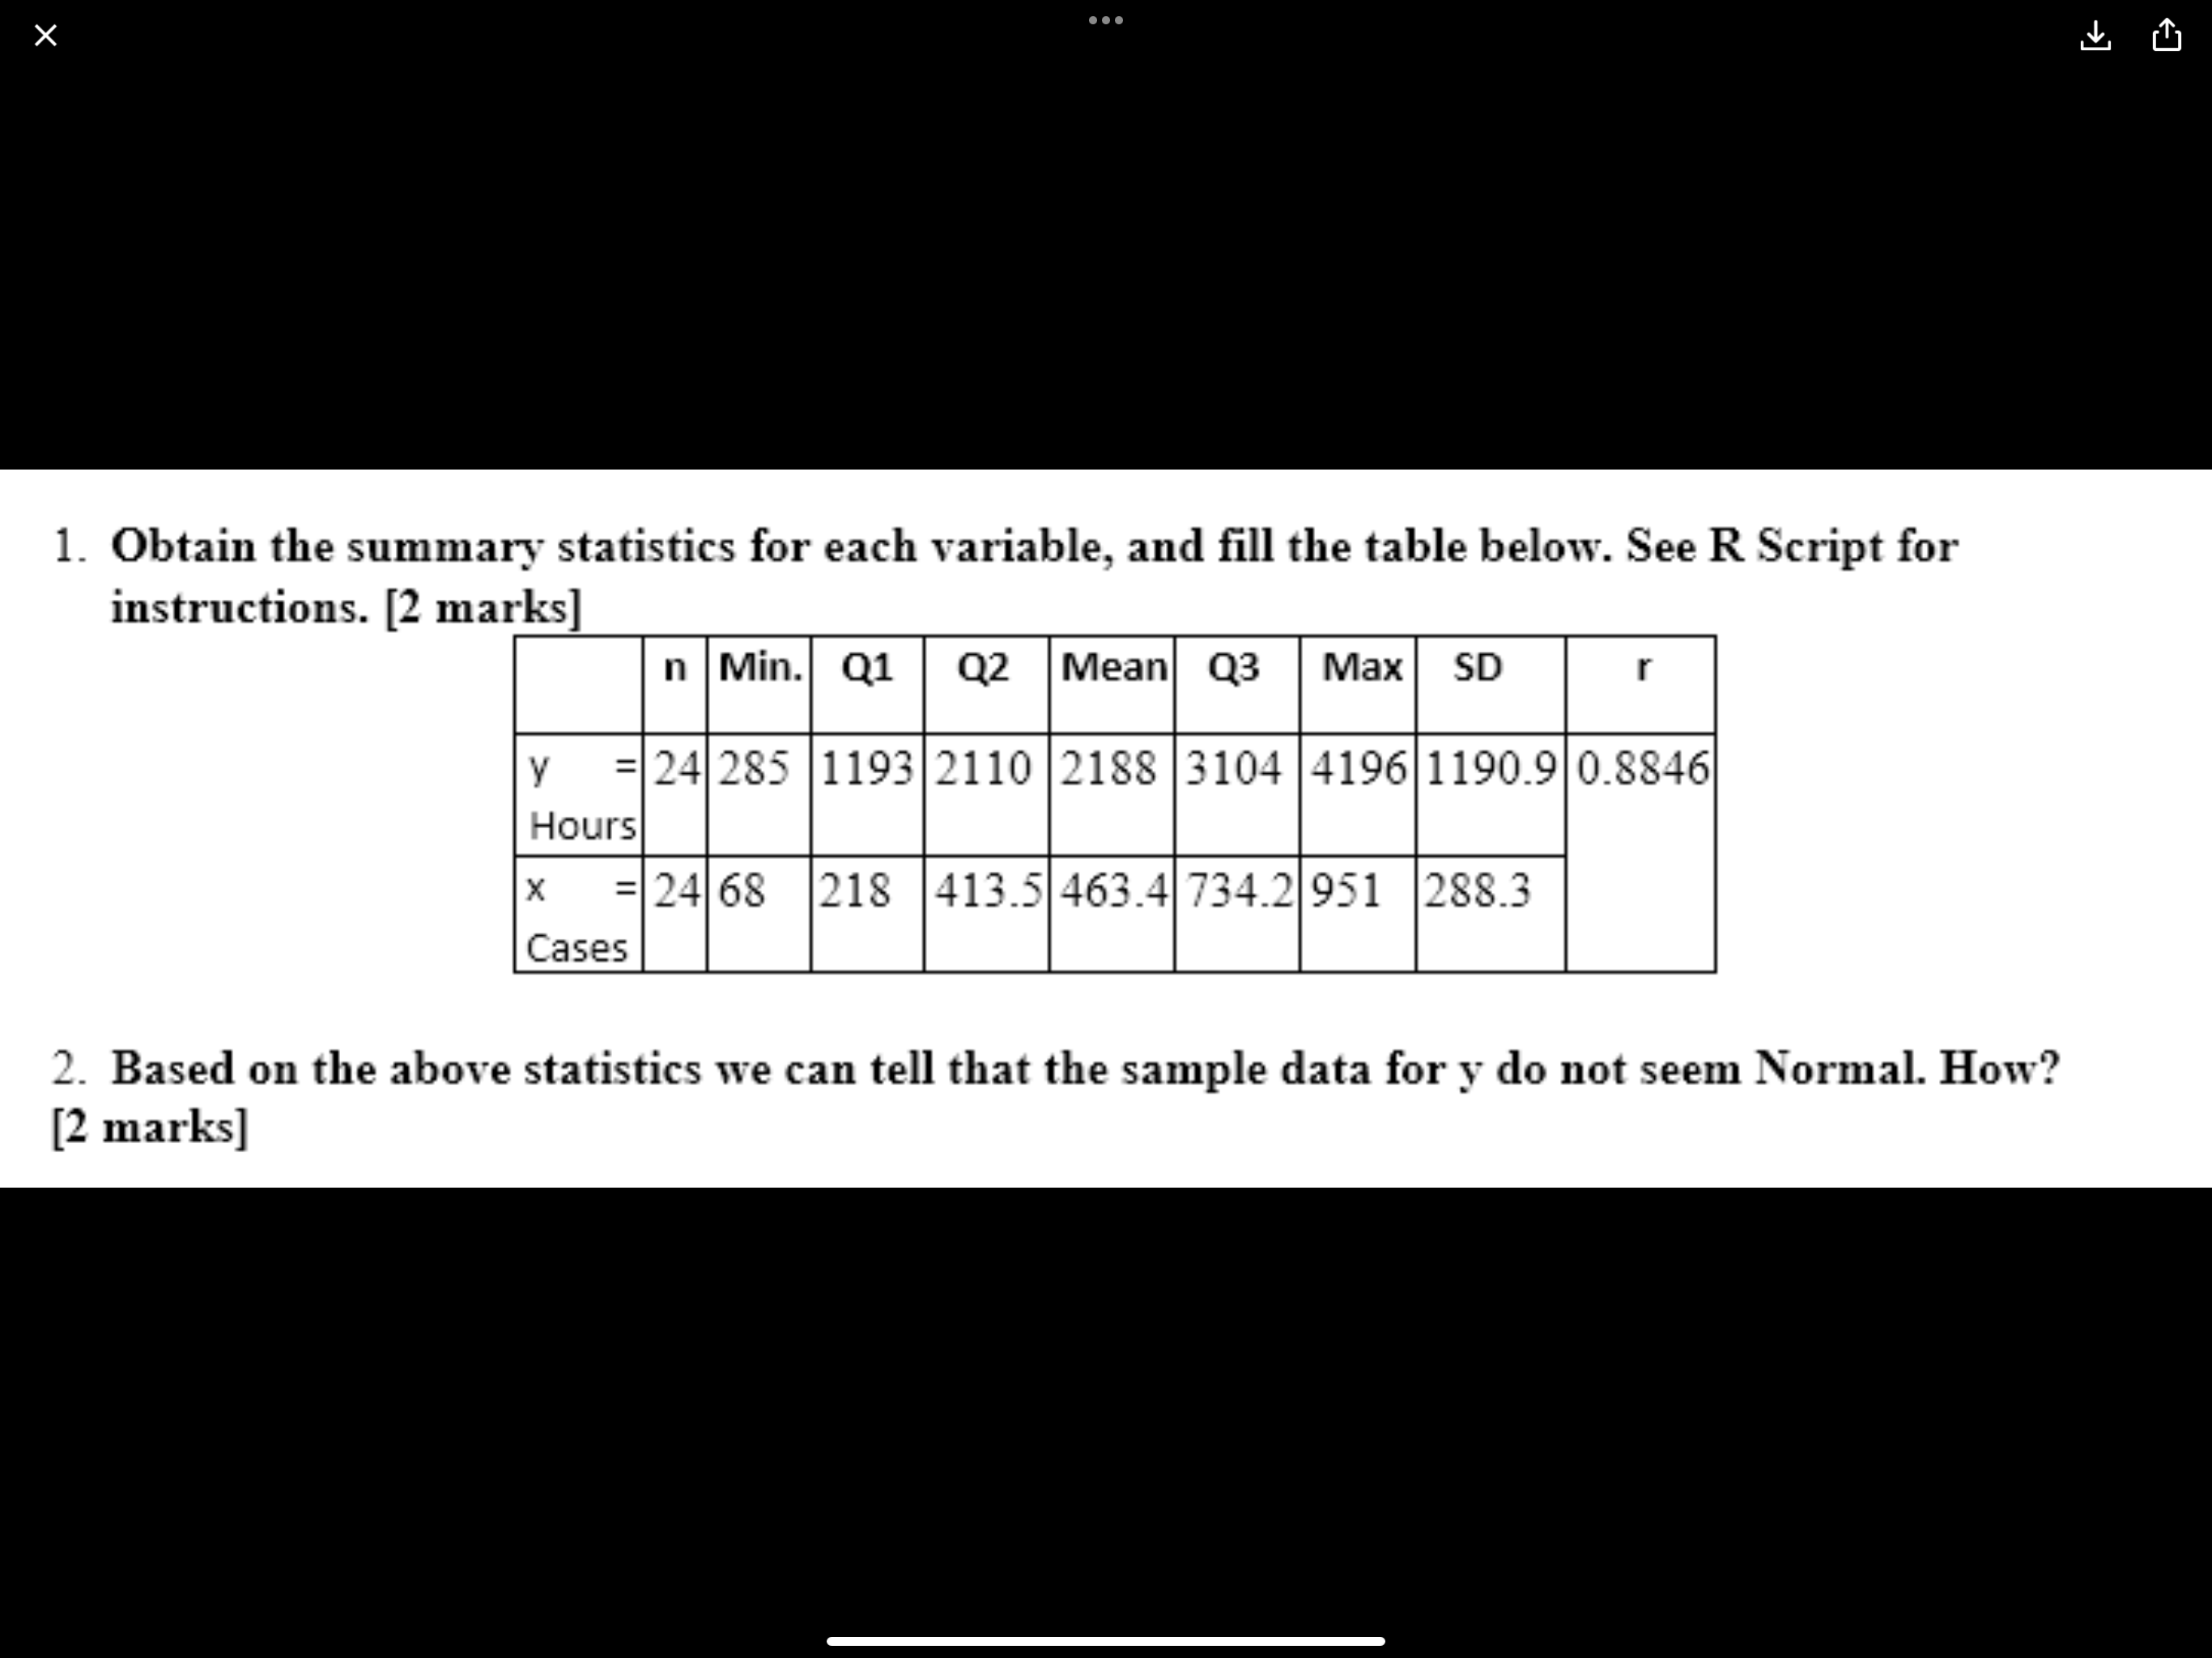
1. Obtain the summary statistics for each variable, and ll the table below. See R Script for instructions. [2 marks] Y = 24 285 1193 2110 2188 3104 4196 0.8846 Hours Cases 2. Based on the above statistics we can tell that the sample data for y do not seem Normal. How? [2 marks]
Step by Step Solution
There are 3 Steps involved in it
1 Expert Approved Answer
Step: 1 Unlock

Question Has Been Solved by an Expert!
Get step-by-step solutions from verified subject matter experts
Step: 2 Unlock
Step: 3 Unlock