

Question: 1. On a single page, carezlly plot out both countries' PPFs, side by side, based on the information in Table 1 (So there will be

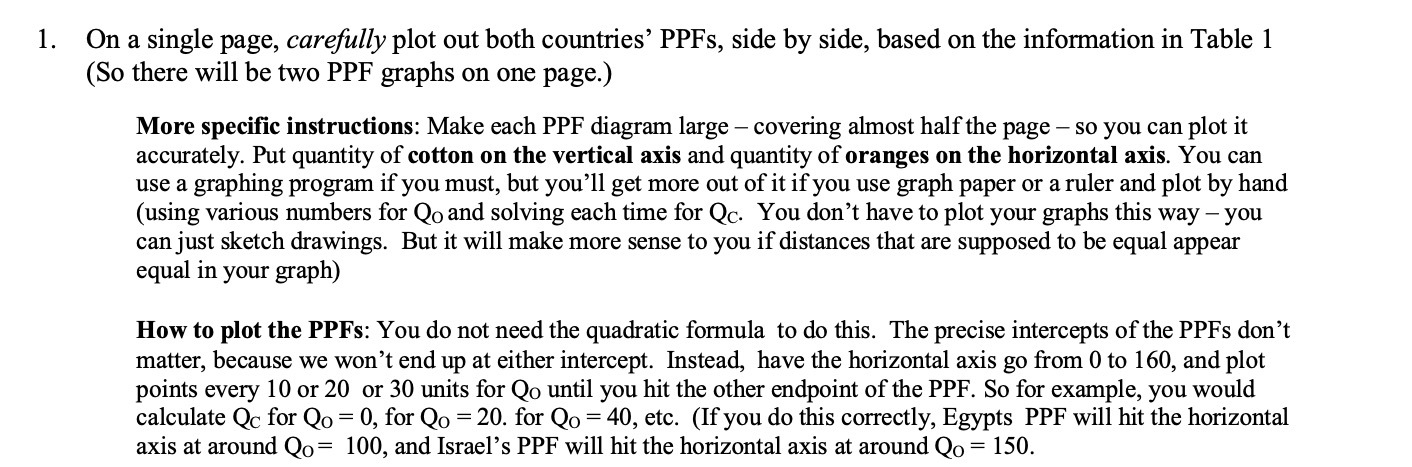
1. On a single page, carezlly plot out both countries' PPFs, side by side, based on the information in Table 1 (So there will be two PPF graphs on one page.) More specic instructions: Make each PPF diagram large covering almost half the page so you can plot it accurately. Put quantity of cotton on the vertical axis and quantity of oranges on the horizontal axis. You can use a graphing program if you must, but you'll get more out of it if you use graph paper or a ruler and plot by hand (using various numbers for Q0 and solving each time for Q3. You don't have to plot your graphs this way you can just sketch drawings. But it will make more sense to you if distances that are supposed to be equal appear equal in your graph) How to plot the PPFs: You do not need the quadratic formula to do this. The precise intercepts of the PPFs don't matter, because we won't end up at either intercept. Instead, have the horizontal axis go from 0 to 160, and plot points every 10 or 20 or 30 units for Q0 until you hit the other endpoint of the PPF. So for example, you would calculate Q: for Q0 = 0, for Q0 = 20. for Q0 = 40, etc. (If you do this correctly, Egypts PPF will hit the horizontal axis at around Qo= 100, and Israel's PPF will hit the horizontal axis at around Qo = 150
Step by Step Solution
There are 3 Steps involved in it

Get step-by-step solutions from verified subject matter experts