

Question: 1 . On the map shown in Figure 1 , a site will be developed as an office building ( Land Use: 7 0 1
On the map shown in Figure a site will be developed as an office building Land Use:
Weekday Urban Peak Period Parking Demand with a gross leasable area x of thousand
square feet. Conduct a traffic impact study and a parking study for this site. The time points to be
considered are:
The present time
The time when the development becomes fully operational years from the present time;
annual growth of background traffic
A target year set at years from the time when the development becomes operation
annual growth of background traffic
The tripgeneration equations are:
AM peakhour trips T: ln T ln x with enter and exit
PM peakhour trips T: ln T ln x with enter and exit
It is likely that signalized control should be placed at the site access point. This T intersection
along with intersections I and I must be analyzed for onehour in the AM and PM weekday peak
period. New signal timings should be estimated and up to one additional lane per approach may be placed
if the approach LOS is worse than a C Estimates of through traffic at the access point should result from
the volumes of intersection I All three intersections must operate under compatible cycle lengths so that
arterial progression is maintained.
The expected modal splits are as follows:
Opening time t : drive alone, car pool occupancy
Target time t : drive alone, car pool occupancy
use rail transit
In t and t distribute volumes per lane so that flow rations are approximately equal.
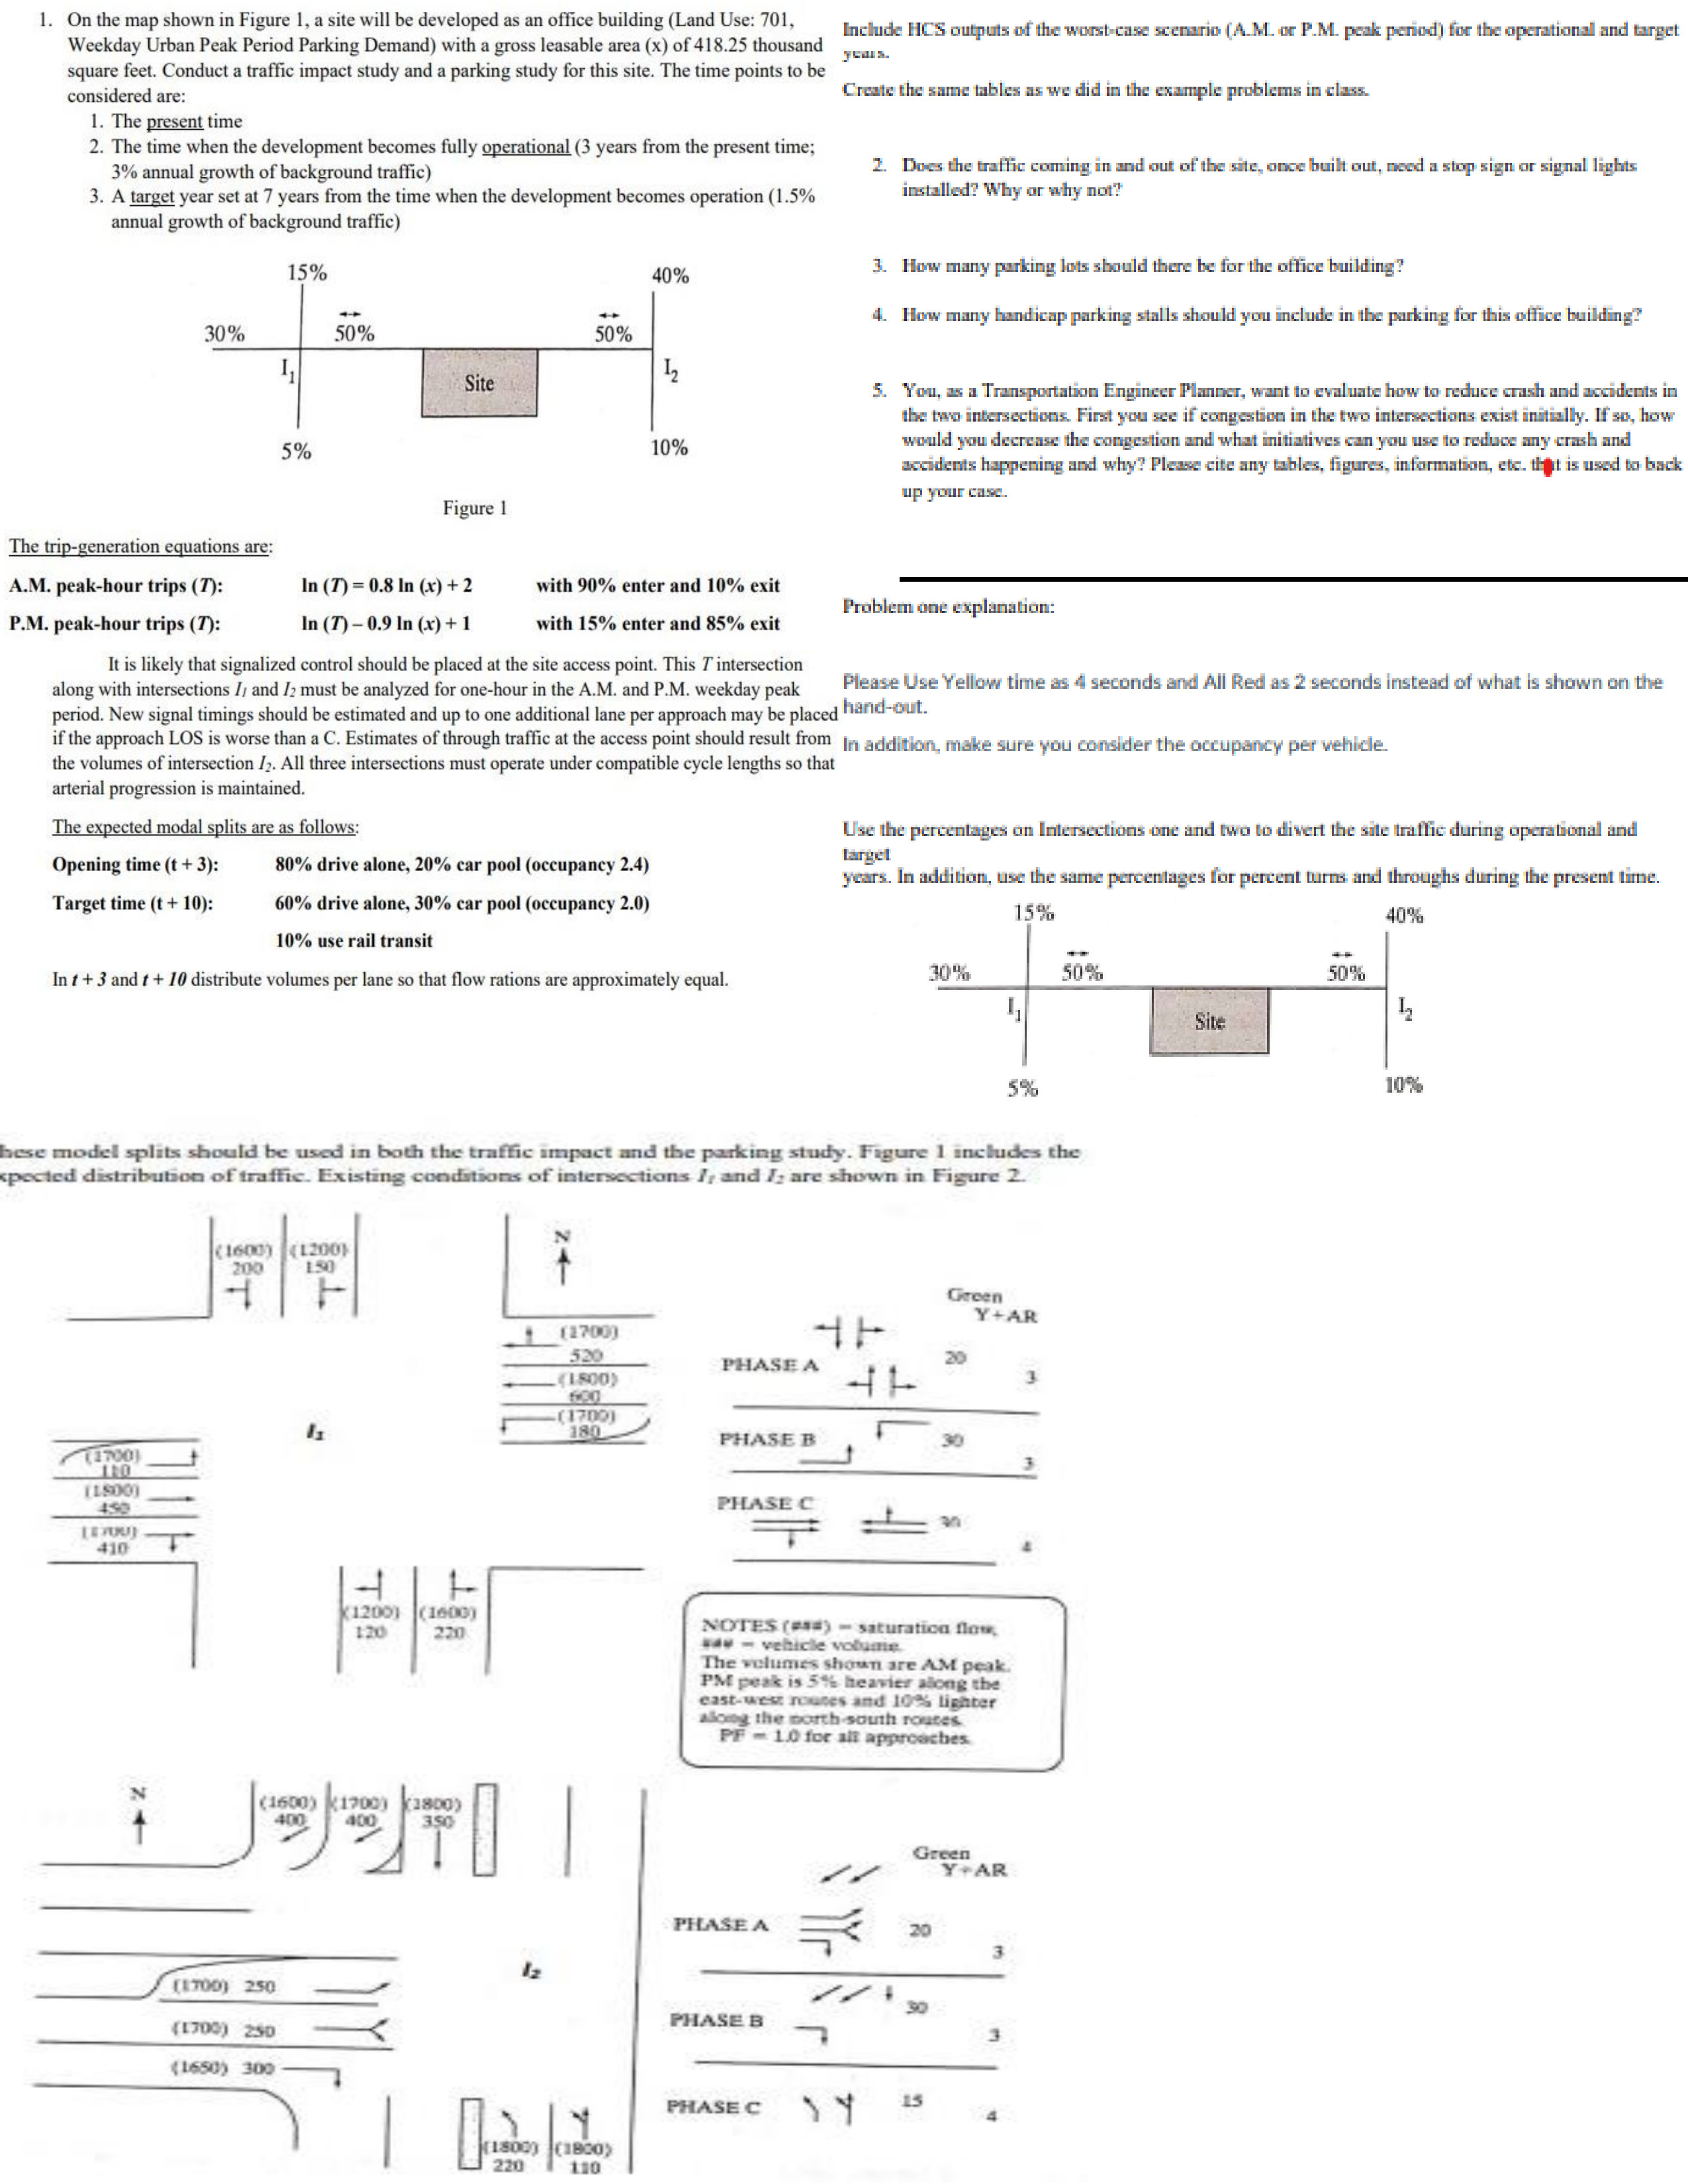
These model splits should be used in both the traffic impact and the parking study. Figure includes the
expected distribution of traffic. Existing conditions of intersections I and I are shown in Figure
Figure
I
I
Include HCS outputs of the worstcase scenario AM or PM peak period for the operational and target
years.
Create the same tables as we did in the example problems in class.
Does the traffic coming in and out of the site, once built out, need a stop sign or signal lights
installed? Why or why not?
How many parking lots should there be for the office building?
How many handicap parking stalls should you include in the parking for this office building?
You, as a Transportation Engineer Planner, want to evaluate how to reduce crash and accidents in
the two intersections. First you see if congestion in the two intersections exist initially. If so how
would you decrease the congestion and what initiatives can you use to reduce any crash and
accidents happening and why? Please cite any tables, figures, information, etc. that is used to back
up your case.
Problem one explanation:
Please Use Yellow time as seconds and All Red as seconds instead of what is shown on the
handout.
In addition, make sure you consider the occupancy per vehicle.
Use the percentages on Intersections one and two to divert the site traffic during operational and
target
years. In addition, use the same percentages for percent turns and throughs during the present time.
Example: If you calculated vehicles exiting the site, then is going right and the other is
going left. Then take each of the volumes and distribute the volume in both intersections. So if
of
the vehicles are turning left then:
vehicles x is turning right x is turning right
vehicles x is turning left x is turning left
vehicles x is going through x is turning right
Do the same for the vehicles going into the site as well.
Then use interpolation to figure out the amount distributed in going through.
For the present time, use the percentages, as shown, to calculate the turns. For example, intersection
one has a south bound throughright and throughleft shared. Therefore:
SB left x
SB right x
SB Through one
SB Through two
Total SB Through
Problem three explanation:
Compare the calculated parking generation to the number of vehicles during peak, going into the
office parking.On the map shown in Figure a site will be developed as an office building Land Use: Weekday Urban Peak Period Parking Demand with a gross leasable area x of thousand square feet. Conduct a traffic impact study and a parking study for this site. The time points to be considered are:
The present time
The time when the development becomes fully operational years from the present time
Step by Step Solution
There are 3 Steps involved in it
1 Expert Approved Answer
Step: 1 Unlock

Question Has Been Solved by an Expert!
Get step-by-step solutions from verified subject matter experts
Step: 2 Unlock
Step: 3 Unlock