

Question: 1. Open an EXCEL document. Complete a Pareto Table and graph. Remember to identify your charts/graphs- Main Titles, X-Axis and Y-Axis. 2. Choose the top
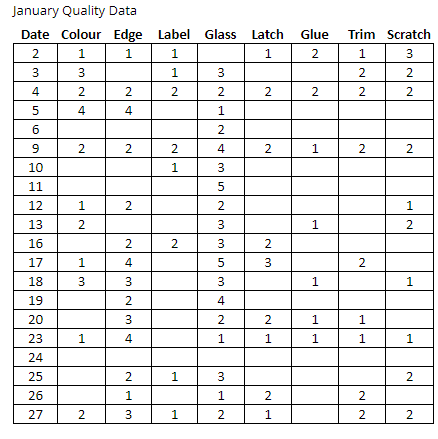 1. Open an EXCEL document. Complete a Pareto Table and graph. Remember to identify your charts/graphs- Main Titles, X-Axis and Y-Axis. 2. Choose the top two defects from your Pareto analysis. For each one of these, produce a run (line) chart. Have the x axis with the days of the month, and the y axis with the number of times that defect occured. This will give you information about the occurance of each of those two defects.
Step by Step Solution
There are 3 Steps involved in it
1 Expert Approved Answer
Step: 1 Unlock

Question Has Been Solved by an Expert!
Get step-by-step solutions from verified subject matter experts
Step: 2 Unlock
Step: 3 Unlock