

Question: 1) Output from a process contains 0.02 defective unit. Defective units that go undetected into final assemblies cost $25 each to replace. An inspection process,
1)
Output from a process contains 0.02 defective unit. Defective units that go undetected into final assemblies cost $25 each to replace. An inspection process, which would detect and remove all defectives, can be established to test these units. However, the inspector, who can test 20 units per hour, is paid $8 per hour, including fringe benefits. Should an inspec-tion station be established to test all units?
a. What is the cost to inspect each unit?
b. What is the benefit (or loss) from the inspection process?
2) C-Spec, Inc., is attempting to determine whether an existing machine is capable of mill-ing an engine part that has a key specification of 4 .003 inches. After a trial run on this machine, C-Spec has determined that the machine has a sample mean of 4.001 inches with a standard deviation of .002 inch. (Answer in Appendix D)
a. Calculate the Cpk for this machine.
b. Should C-Spec use this machine to produce this part? Why?
3) A shirt manufacturer buys cloth by the 100-yard roll from a supplier. For setting up a con-trol chart to manage the irregularities (e.g., loose threads and tears), the following data were collected from a sample provided by the supplier.
Sample 1 2 3 4 5 6 7 8 9 10
Irregularities 3 5 2 6 5 4 6 3 4 5
a. Using these data, set up a c-chart with z = 2.
b. Suppose the next five rolls from the supplier had three, two, five, three, and seven irregularities. Is the supplier process under control?
4) Resistors for electronic circuits are manufactured on a high-speed automated machine. The machine is set up to produce a large run of resistors of 1,000 ohms each. To set up the machine and to create a control chart to be used throughout the run, 15 samples were taken with four resistors in each sample. The complete list of samples and their measured values are as follows.
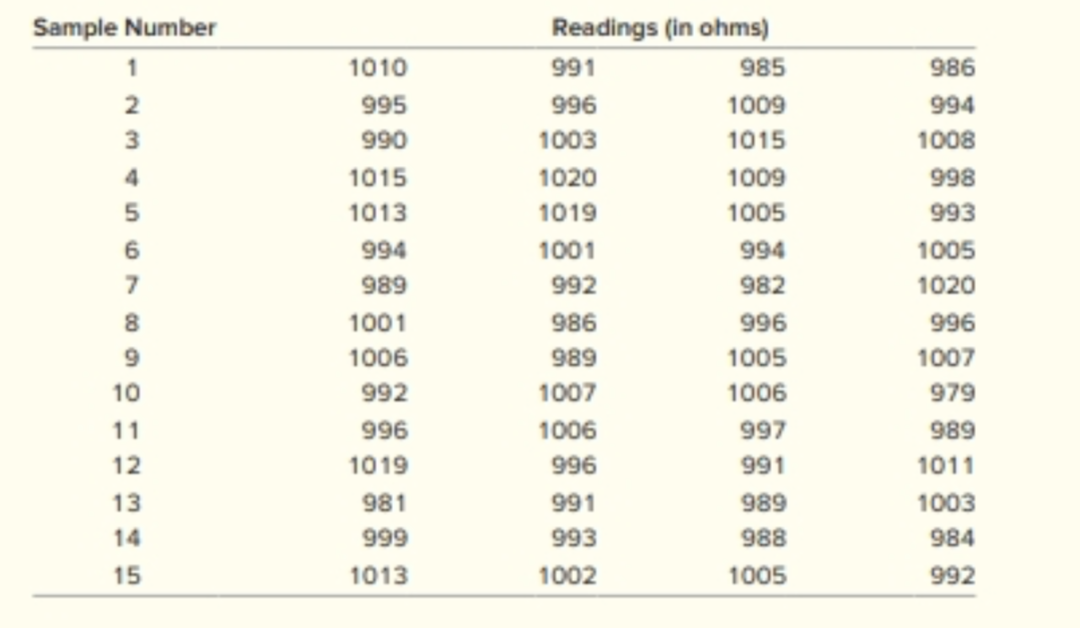
Develop an X chart and an R-chart and plot the values. From the charts, what comments can you make about the pr
\begin{tabular}{crrrr} Sample Number & \multicolumn{4}{c}{ Readings (in ohms) } \\ \hline 1 & 1010 & 991 & 985 & 986 \\ 2 & 995 & 996 & 1009 & 994 \\ 3 & 990 & 1003 & 1015 & 1008 \\ 4 & 1015 & 1020 & 1009 & 998 \\ 5 & 1013 & 1019 & 1005 & 993 \\ 6 & 994 & 1001 & 994 & 1005 \\ 7 & 989 & 992 & 982 & 1020 \\ 8 & 1001 & 986 & 996 & 996 \\ 9 & 1006 & 989 & 1005 & 1007 \\ 10 & 992 & 1007 & 1006 & 979 \\ 11 & 996 & 1006 & 997 & 989 \\ 12 & 1019 & 996 & 991 & 1011 \\ 13 & 981 & 991 & 989 & 1003 \\ 14 & 999 & 993 & 988 & 984 \\ 15 & 1013 & 1002 & 1005 & 992 \\ \hline \end{tabular}
Step by Step Solution
There are 3 Steps involved in it

Get step-by-step solutions from verified subject matter experts