

Question: 1. Part | - Open the rst attached Excel spreadsheet named Quality Control Analytics at Toyota. Although it is named Toyota, this spreadsheet is NOT
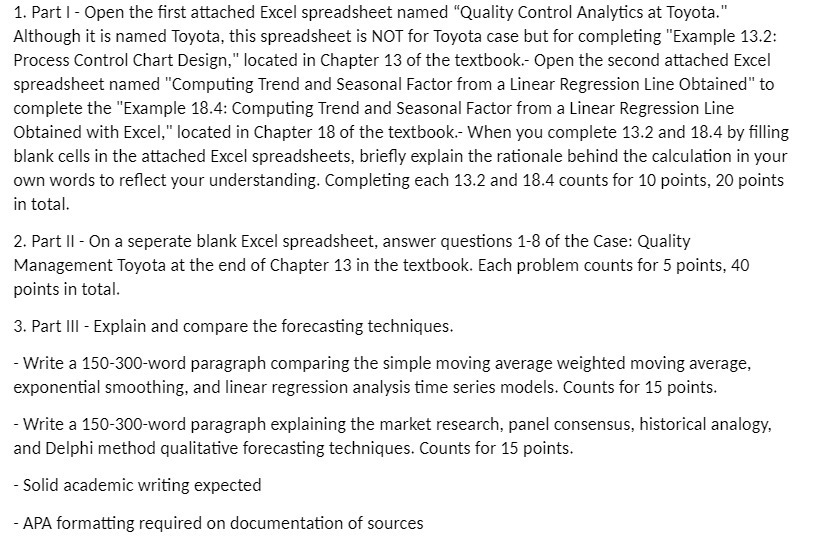
1. Part | - Open the rst attached Excel spreadsheet named "Quality Control Analytics at Toyota." Although it is named Toyota, this spreadsheet is NOT for Toyota case but for completing "Example 13.2: Process Control Chart Design," located in Chapter 13 of the textbook: Open the second attached Excel spreadsheet named "Computing Trend and Seasonal Factor from a Linear Regression Line Obtained " to complete the "Example 18.4: Computing Trend and Seasonal Factor from a Linear Regression Line Obtained with Excel," located in Chapter 18 of the textbook.- When you complete 13.2 and 18.4 by lling blank cells in the attached Excel spreadsheets, briefly explain the rationale behind the calculation in your own words to reect your understanding. Com pleb' ng each 13.2 and 18.4 counts for 10 points, 20 points in total. 2. Part II On a seperate blank Excel spreadsheet, answer questions 18 of the Case: Quality Management Toyota at the end of Chapter 13 in the textbook. Each problem counts for 5 points, 40 points in total. 3. Part III Explain and compare the forecasting techniques. - Write a 150-SOU-word paragraph comparing the simple moving average weighted moving average, exponential smoothing, and linear regression analysis time series models. Counts for 15 points. - Write a 150-3OUword paragraph explaining the market research, panel consensus, historical analogy, and Delphi method qualitative forecasting techniques. Counts for 15 points. - Solid academic writing expected - APR formatting required on documentation of sources
Step by Step Solution
There are 3 Steps involved in it

Get step-by-step solutions from verified subject matter experts