

Question: 1- please explain this graph, and what does it mean to each cimpanyboeing , airbus and the industry average, ultimately mention which one is better.
1- please explain this graph, and what does it mean to each cimpanyboeing , airbus and the industry average, ultimately mention which one is better. 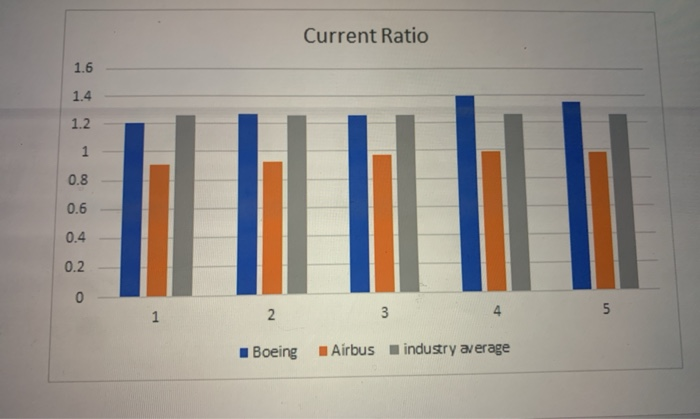
Current Ratio 1.6 1.4 1.2 0.8 0.6 0.4 0.2 3 I Boeing IAirbus industry average
Step by Step Solution
There are 3 Steps involved in it
1 Expert Approved Answer
Step: 1 Unlock

Question Has Been Solved by an Expert!
Get step-by-step solutions from verified subject matter experts
Step: 2 Unlock
Step: 3 Unlock