

Question: 1 please help me with this excel assignment. make sure to answer all the parts ON EXCEL and show the formula. i will give you
1 please help me with this excel assignment. make sure to answer all the parts ON EXCEL and show the formula. i will give you a up vote. thanks 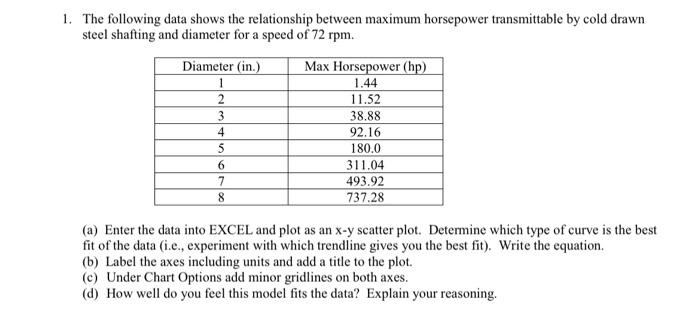
The following data shows the relationship between maximum horsepower transmittable by cold drawn steel shafting and diameter for a speed of 72rpm. (a) Enter the data into EXCEL and plot as an x-y scatter plot. Determine which type of curve is the best fit of the data (i.e., experiment with which trendline gives you the best fit). Write the equation. (b) Label the axes including units and add a title to the plot. (c) Under Chart Options add minor gridlines on both axes. (d) How well do you feel this model fits the data? Explain your reasoning
Step by Step Solution
There are 3 Steps involved in it
1 Expert Approved Answer
Step: 1 Unlock

Question Has Been Solved by an Expert!
Get step-by-step solutions from verified subject matter experts
Step: 2 Unlock
Step: 3 Unlock