

Question: 1. Please indicate whether the following variables are continuous or discrete. Variable Name Discrete or Continuous? Annual income Time Number of shoes you own Human
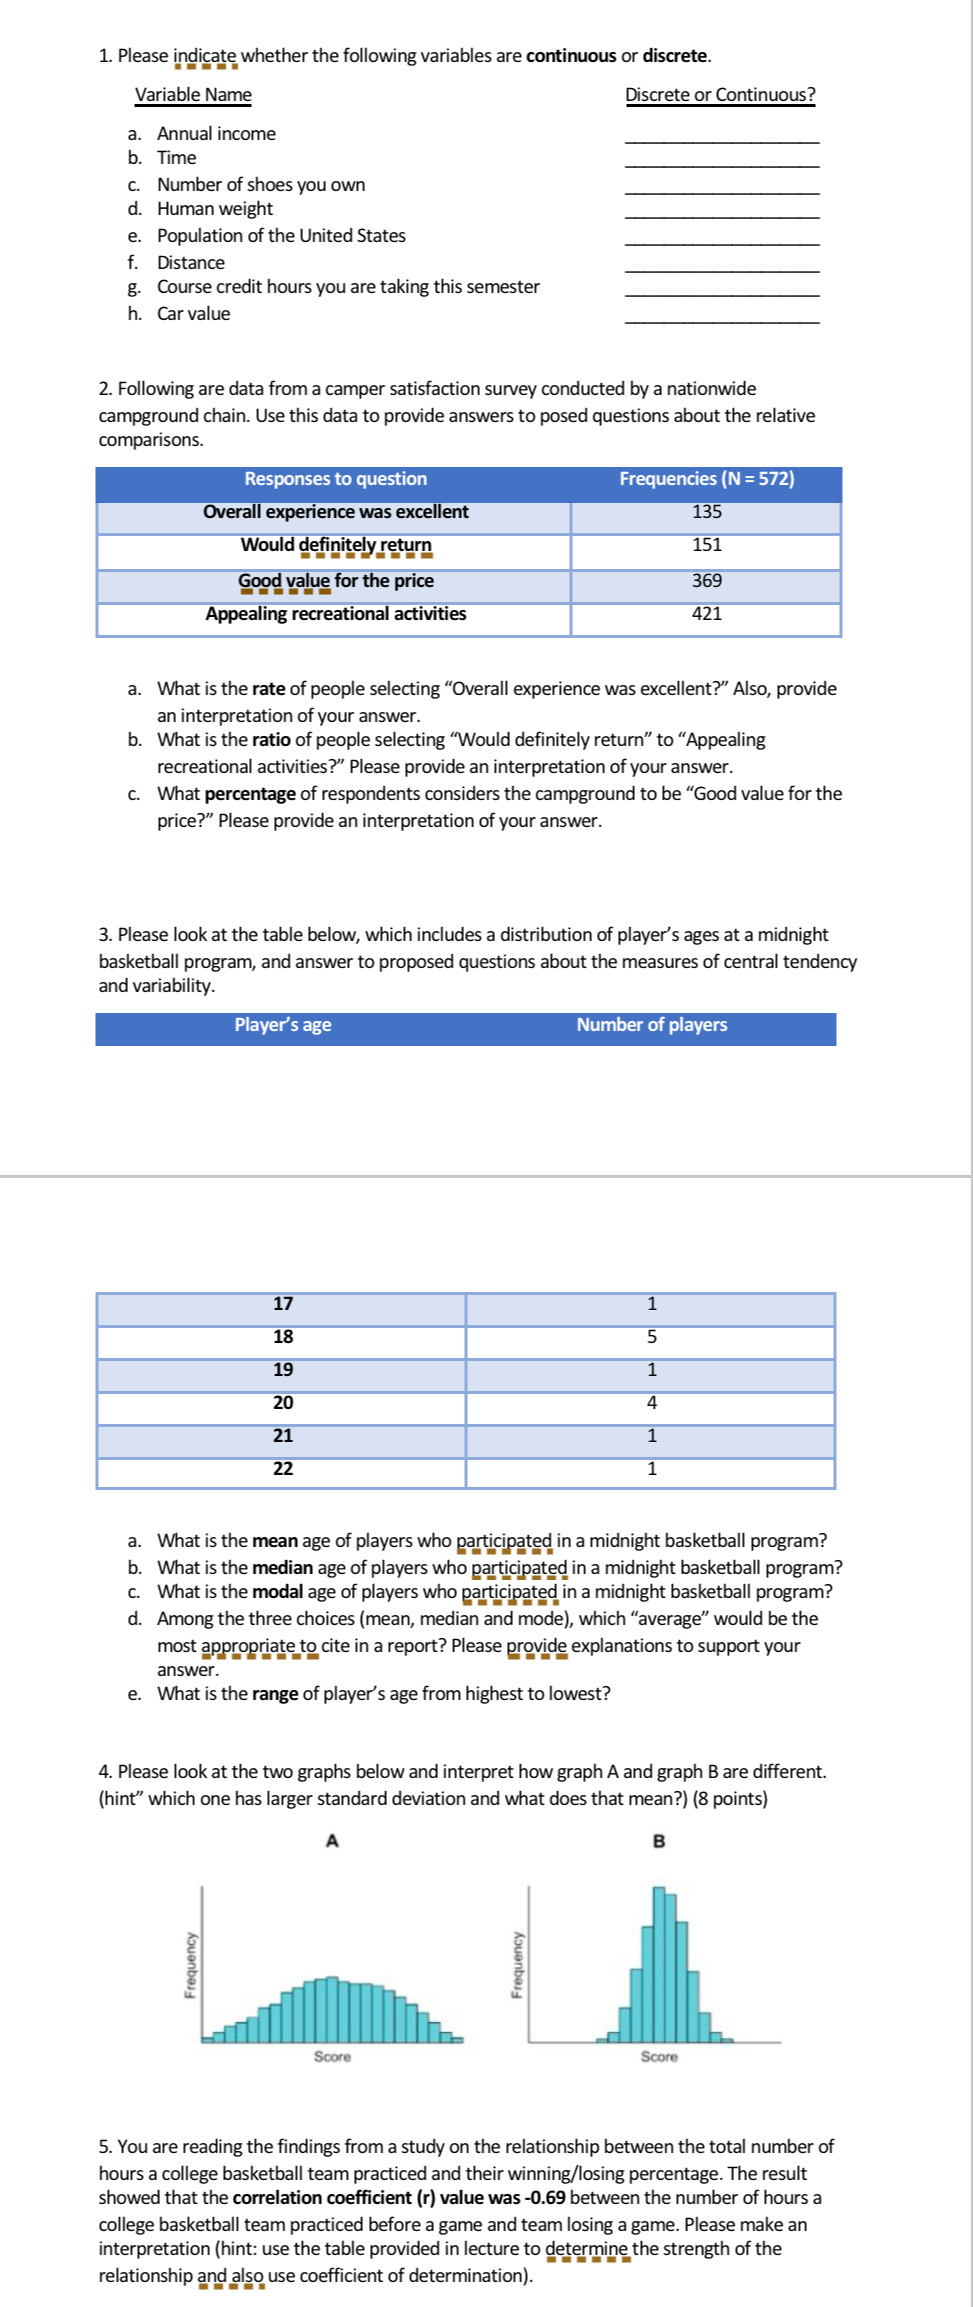 1. Please indicate whether the following variables are continuous or discrete. Variable Name Discrete or Continuous? Annual income Time Number of shoes you own Human weight Population of the United States Distance Course credit hours you are taking this semester Tampon oD Car value 2. Following are data from a camper satisfaction survey conducted by a nationwide campground chain. Use this data to provide answers to posed questions about the relative comparisons. peanttaes to question Frequencies (N = 572) a Would d i a. What is the rate of people selecting \"Overall experience was excellent?\" Also, provide an interpretation of your answer. b. Whatis the ratio of people selecting \"Would definitely return\" to \"Appealing recreational activities?\" Please provide an interpretation of your answer. c. What percentage of respondents considers the campground to be \"Good value for the price?\" Please provide an interpretation of your answer. 3. Please look at the table below, which includes a distribution of player's ages at a midnight basketball program, and answer to proposed questions about the measures of central tendency and variability. aE ee) Dan elmel ee eyed What is the mean age of players who participated in a midnight basketball program? What is the median age of players who participated in a midnight basketball program? What is the modal age of players who participated i in a midnight basketball program? Among the three choices (mean, median and mode), which \"average\" would be the most appropriate to cite in a report? Please provide explanations to support your aoop answer. e. Whatis the range of player's age from highest to lowest? 4. Please look at the two graphs below and interpret how graph A and graph B are different. (hint\" which one has larger standard deviation and what does that mean?) (8 points) A B z z Score Score 5. You are reading the findings from a study on the relationship between the total number of hours a college basketball team practiced and their winning/losing percentage. The result showed that the correlation coefficient (r) value was -0.69 between the number of hours a college basketball team practiced before a game and team losing a game. Please make an interpretation (hint: use the table provided in lecture to determine the strength of the relationship and also use coefficient of determination)
Step by Step Solution
There are 3 Steps involved in it
1 Expert Approved Answer
Step: 1 Unlock

Question Has Been Solved by an Expert!
Get step-by-step solutions from verified subject matter experts
Step: 2 Unlock
Step: 3 Unlock