

Question: 1. Please make a scatterplot of this graph in Excel. 2. Determine the LINEST function of the scatterplot to the CORRECT sig figs. 3. What
1. Please make a scatterplot of this graph in Excel.
2. Determine the LINEST function of the scatterplot to the CORRECT sig figs.
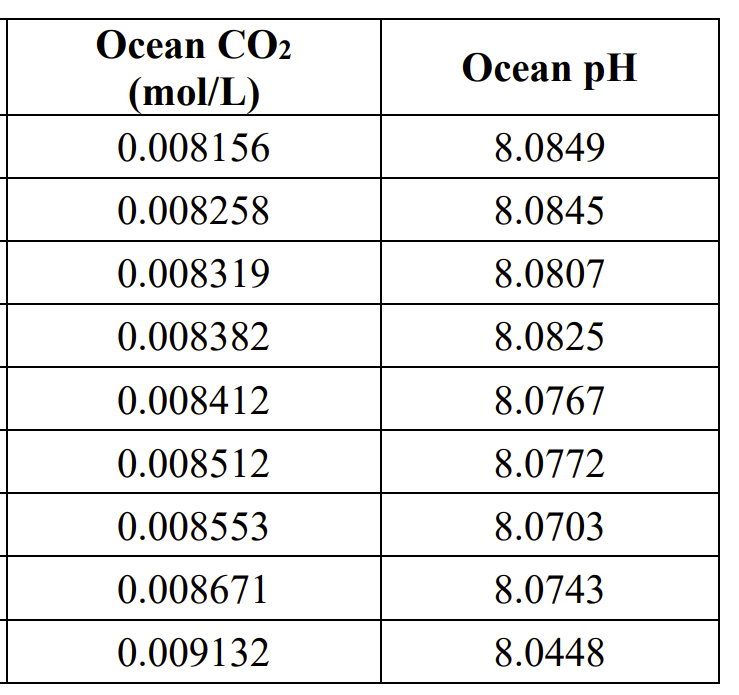
3. What are the units of the slope if pH has no units?
\begin{tabular}{|c|c|} \hline OceanCO(mol/L) & Ocean pH \\ \hline 0.008156 & 8.0849 \\ \hline 0.008258 & 8.0845 \\ \hline 0.008319 & 8.0807 \\ \hline 0.008382 & 8.0825 \\ \hline 0.008412 & 8.0767 \\ \hline 0.008512 & 8.0772 \\ \hline 0.008553 & 8.0703 \\ \hline 0.008671 & 8.0743 \\ \hline 0.009132 & 8.0448 \\ \hline \end{tabular}
Step by Step Solution
There are 3 Steps involved in it
1 Expert Approved Answer
Step: 1 Unlock

Question Has Been Solved by an Expert!
Get step-by-step solutions from verified subject matter experts
Step: 2 Unlock
Step: 3 Unlock