

Question: 1. Please show step by step in Minitab to get the results: a) A study was made to determine the effect of stirring rate on
1. Please show step by step in Minitab to get the results:
a) A study was made to determine the effect of stirring rate on the amount of impurity in paint produced by a chemical process. The study yielded the following data. Based on the information, what is the linear model of this data?
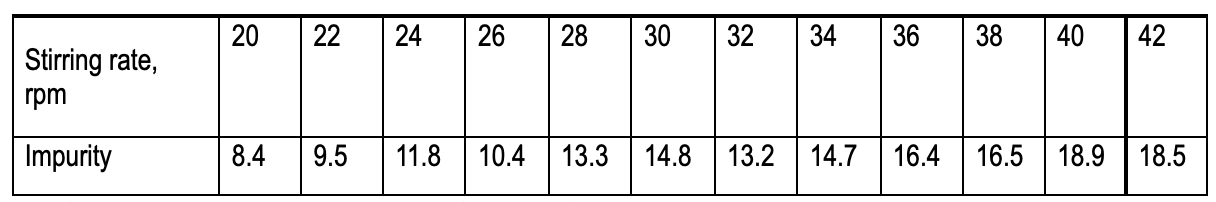
b) What is the result of the test for significance of regression? (Use table above)
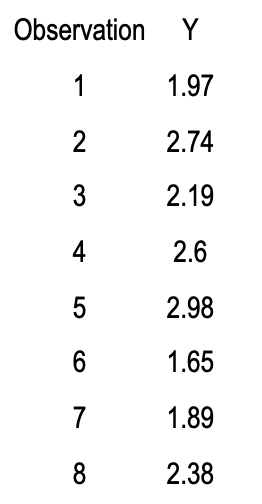
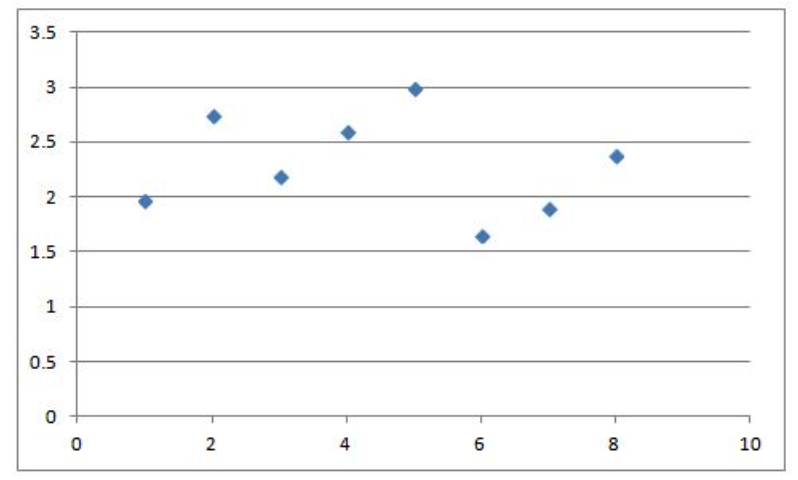
3. Construct a scatterplot with Score on the y-axis. Fit the estimated linear regression line. What is your conclusion?
Step by Step Solution
There are 3 Steps involved in it
1 Expert Approved Answer
Step: 1 Unlock

Question Has Been Solved by an Expert!
Get step-by-step solutions from verified subject matter experts
Step: 2 Unlock
Step: 3 Unlock