

Question: 1. Plot one graph of the Spring Force vs. Stretch with each spring's data on the same axes using google sheets and include the
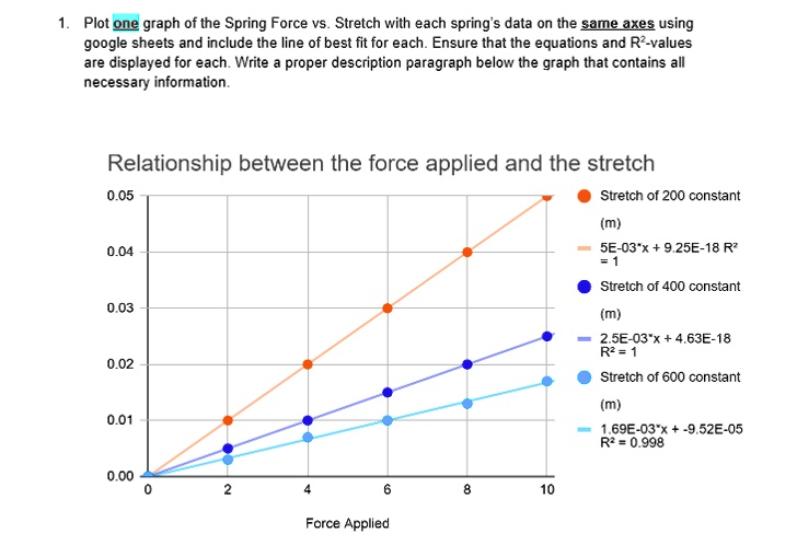
1. Plot one graph of the Spring Force vs. Stretch with each spring's data on the same axes using google sheets and include the line of best fit for each. Ensure that the equations and R-values are displayed for each. Write a proper description paragraph below the graph that contains all necessary information. Relationship between the force applied and the stretch 0.05 0.04 0.03 0.02 0.01 0.00 0 2 6 Force Applied 80 10 Stretch of 200 constant (m) 5E-03*x + 9.25E-18 R = 1 Stretch of 400 constant (m) 2.5E-03*x + 4.63E-18 R = 1 Stretch of 600 constant (m) 1.69E-03*x +-9.52E-05 R = 0.998 2. How do the spring constants from the slopes compare with the known value for each spring? What characteristics do springs have with a larger spring constant? 3. For the maximum stretch of each spring that you have in your graphs, use the equation provided by the graph to calculate the elastic potential energy stored in each spring. It is encouraged that you practice typing out the math using the Google Docs equation editor or the Google Chrome extension Equatio. However, do not sacrifice good form for this.
Step by Step Solution
There are 3 Steps involved in it

Get step-by-step solutions from verified subject matter experts