

Question: 1. Plot the data from Table 1 on a graph using the y-axis to represent the displacement from the starting position (y=0) and the

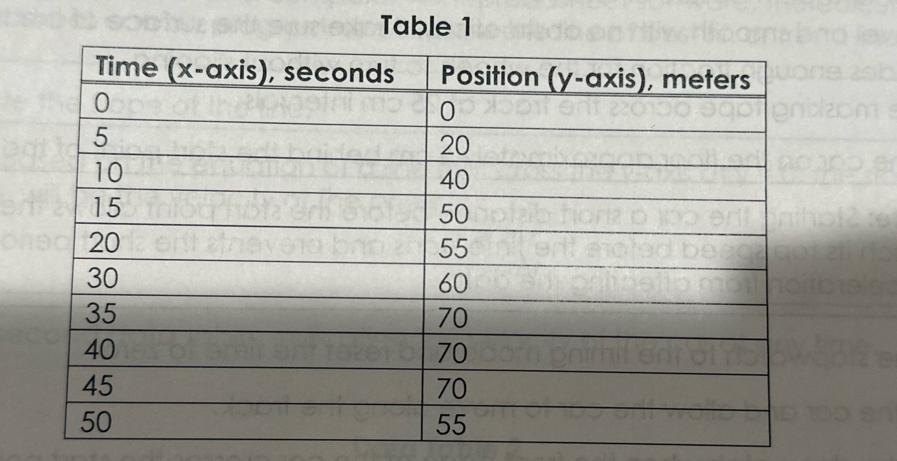
1. Plot the data from Table 1 on a graph using the y-axis to represent the displacement from the starting position (y=0) and the time coordinate on the x-axis. no mortizog alpiniev bro emil prit broos o ewoq eril no 300 ait vevoe Table 1 Time (x-axis), seconds 0 5 10 2 15 onec 20 30 35 40 45 50 Position (y-axis), meters 0 X50 en 220100 3901 ent 20 40 50 55 60 70 70 porn phimhit 70 55 ball rilbrihis 12 tol 90cp ali nos moihoitoisis
Step by Step Solution
There are 3 Steps involved in it
1 Expert Approved Answer
Step: 1 Unlock

Question Has Been Solved by an Expert!
Get step-by-step solutions from verified subject matter experts
Step: 2 Unlock
Step: 3 Unlock