

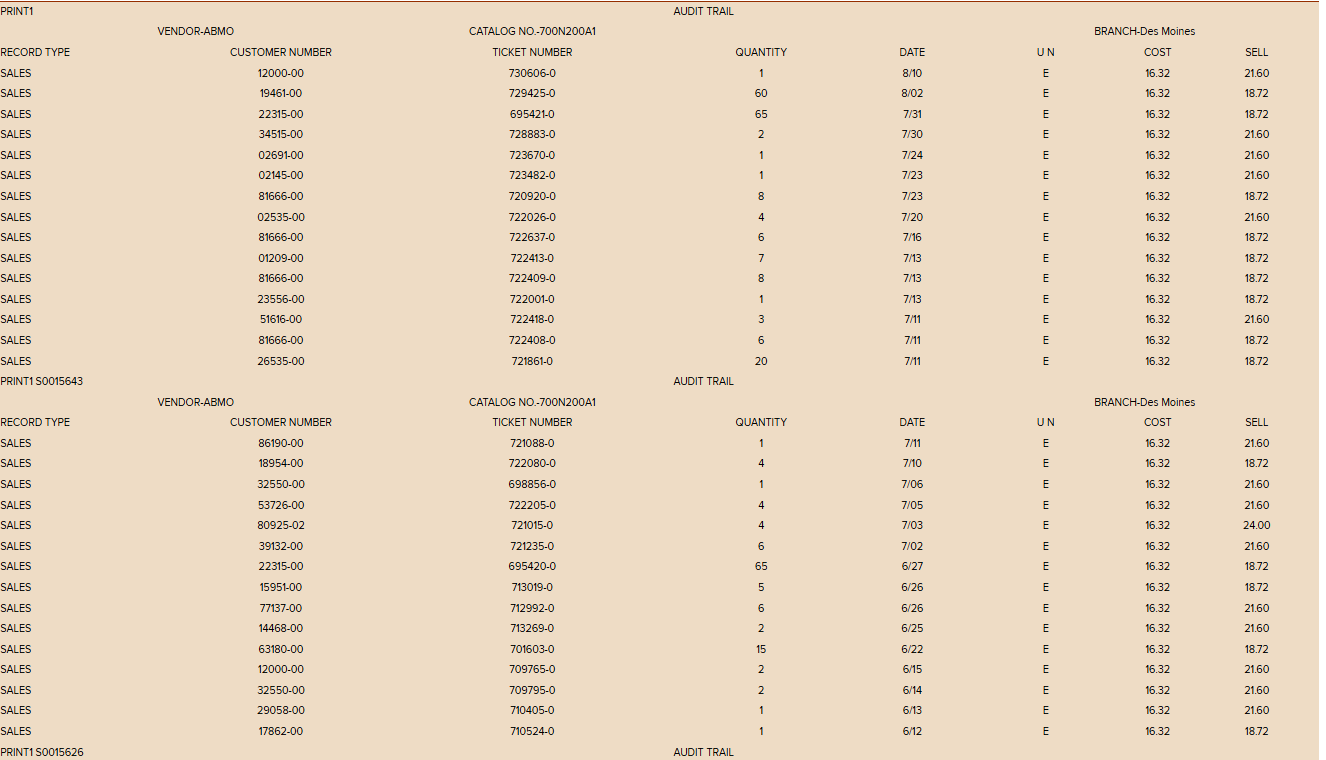
Question: 1 . Plot the frequency distribution for demand of the item in Appendix 1 and draw conclusions from what you observe. Show all images Show
Plot the frequency distribution for demand of the item in Appendix and draw conclusions from what you observe.
Step by Step Solution
There are 3 Steps involved in it
1 Expert Approved Answer
Step: 1 Unlock

Question Has Been Solved by an Expert!
Get step-by-step solutions from verified subject matter experts
Step: 2 Unlock
Step: 3 Unlock