

Question: 1. Plot the point-and-figure chart, using Xs for uptrends and Os for downtrends. 2. How would a technician evaluate these movements? Discuss why you would
1. Plot the point-and-figure chart, using Xs for uptrends and Os for downtrends.
2. How would a technician evaluate these movements? Discuss why you would expect a technician to buy, sell, or hold the stock based on this chart.
Please give detailed answers to BOTH questions with correct labels in Excel with the required formulas for a great rating. Thank you!
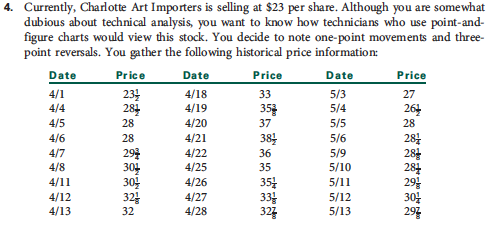
4. Currently, Charlotte Art Importers is selling at $23 per share. Although you are somewhat dubious about technical analysis, you want to know how technicians who use point-and- figure charts would view this stock. You decide to note one-point movements and three- point reversals. You gather the following historical price information: Date Price Date Price Date Price 4/18 41 33 4/19 5/4 4/4 353 4/5 4/20 5/5 38 4/6 4/21 5/6 5/9 29 5/10 4/8 35 29 4/26 35t 30 4/12 324 33 4/27 5/12 4/13 32 5/13 324 29
Step by Step Solution
There are 3 Steps involved in it

Get step-by-step solutions from verified subject matter experts