

Question: (1 point) A contour diagram for a function f (x, y) is shown below. 5- - 18 -19 -20 4 3 21 -24 1 -22
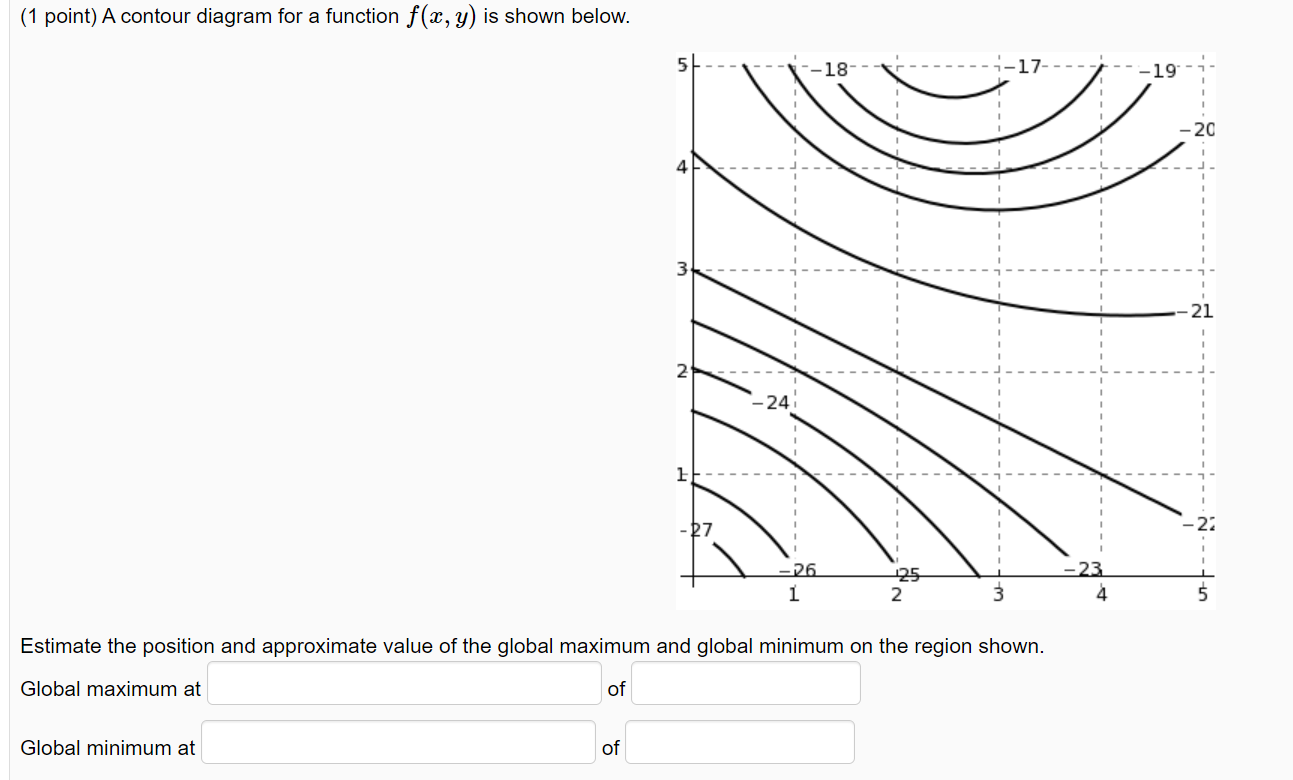
(1 point) A contour diagram for a function f (x, y) is shown below. 5- - 18 -19 -20 4 3 21 -24 1 -22 -26 125 23 1 2 4 Estimate the position and approximate value of the global maximum and global minimum on the region shown. Global maximum at of Global minimum at of
Step by Step Solution
There are 3 Steps involved in it
1 Expert Approved Answer
Step: 1 Unlock

Question Has Been Solved by an Expert!
Get step-by-step solutions from verified subject matter experts
Step: 2 Unlock
Step: 3 Unlock