

Question: (1 point) a) The rectangles in the graph below illustrate a ? The value of this Riemann sum is b) The rectangles in the
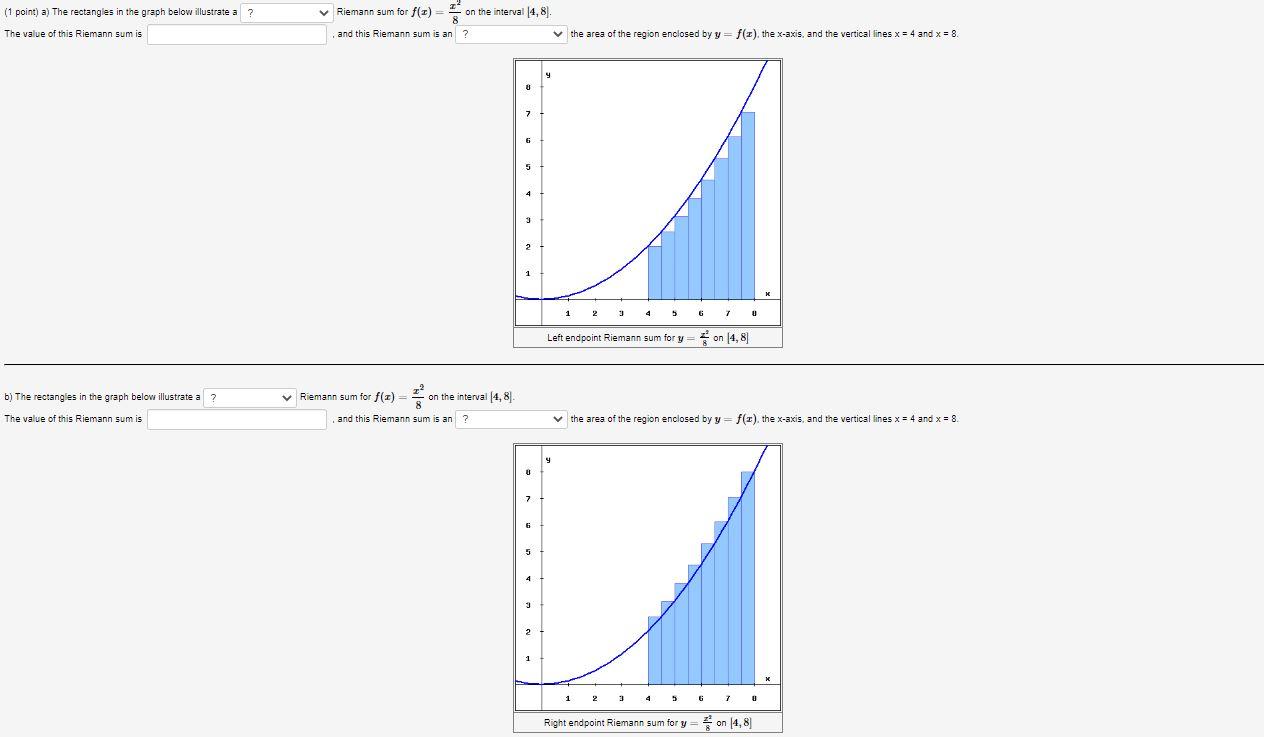
(1 point) a) The rectangles in the graph below illustrate a ? The value of this Riemann sum is b) The rectangles in the graph below illustrate a ? The value of this Riemann sum is Riemann sum for f(x) and this Riemann sum is an ? Riemann sum for f(x) = and this Riemann on the interval [4, 8]. on the interval (4,8). 8 sum is an ? 8 7 6 5 3 2 1 8 7 6 5 4 3 2 1 the area of the region enclosed by y = f(z), the x-axis, and the vertical lines x = 4 and x = 8. 1 2 1 3 2 4 5 Left endpoint Riemann sum for y=on [4,8] 3 G 7 the area of the region enclosed by y = f(x), the x-axis, and the vertical lines x = 4 and x = 8. U 6 7 0 K Right endpoint Riemann sum for yon (4,8)
Step by Step Solution
3.27 Rating (142 Votes )
There are 3 Steps involved in it
Answer a The value of the Riemann sum is the sum of the areas of the rectangles fo... View full answer

Get step-by-step solutions from verified subject matter experts