

Question: ( 1 point ) The diagrams below are supposed to represent level sets for a function with isolated critical points. The heights of the levels
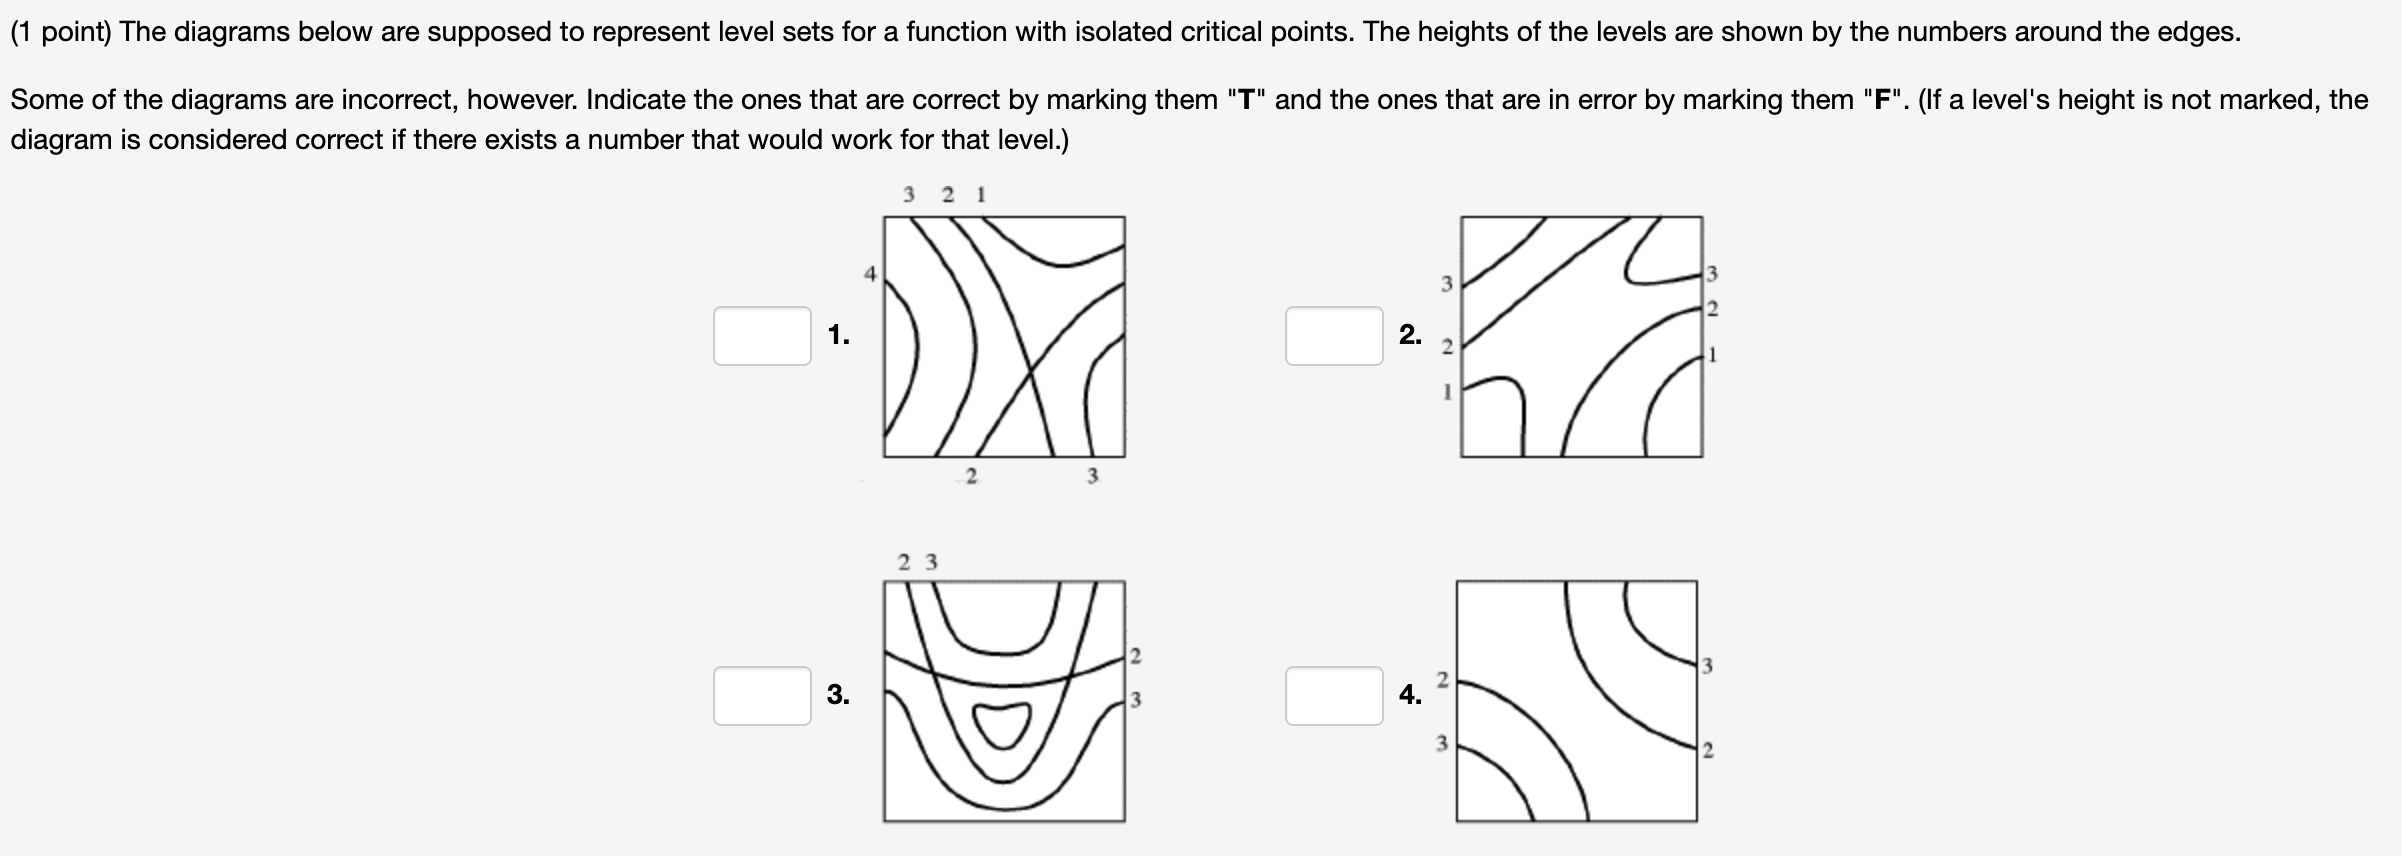
point The diagrams below are supposed to represent level sets for a function with isolated critical points. The heights of the levels are shown by the numbers around the edges.
Some of the diagrams are incorrect, however. Indicate the ones that are correct by marking them T and the ones that are in error by marking them Flf a level's height is not marked, the diagram is considered correct if there exists a number that would work for that level.
Step by Step Solution
There are 3 Steps involved in it
1 Expert Approved Answer
Step: 1 Unlock

Question Has Been Solved by an Expert!
Get step-by-step solutions from verified subject matter experts
Step: 2 Unlock
Step: 3 Unlock