

Question: (1 point) The figure below to the left is a graph of f(x), and below to the right is g(x). L.5 1.5 015 0.5 2
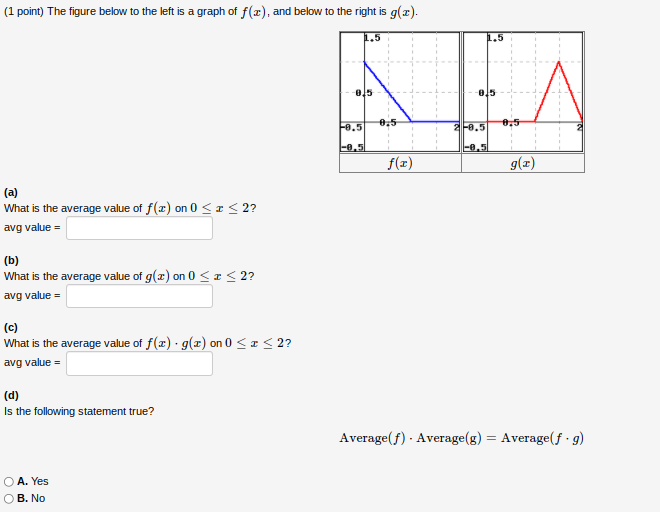
(1 point) The figure below to the left is a graph of f(x), and below to the right is g(x). L.5 1.5 015 0.5 2 0.5 0.5 -0.5 -0.5 f(I) g(c) (a) What is the average value of f(x) on 0
Step by Step Solution
There are 3 Steps involved in it
1 Expert Approved Answer
Step: 1 Unlock

Question Has Been Solved by an Expert!
Get step-by-step solutions from verified subject matter experts
Step: 2 Unlock
Step: 3 Unlock