

Question: (1 point) The graphs below show level sets for six different functions, where the red areas represent the the lowest heights and the purple areas
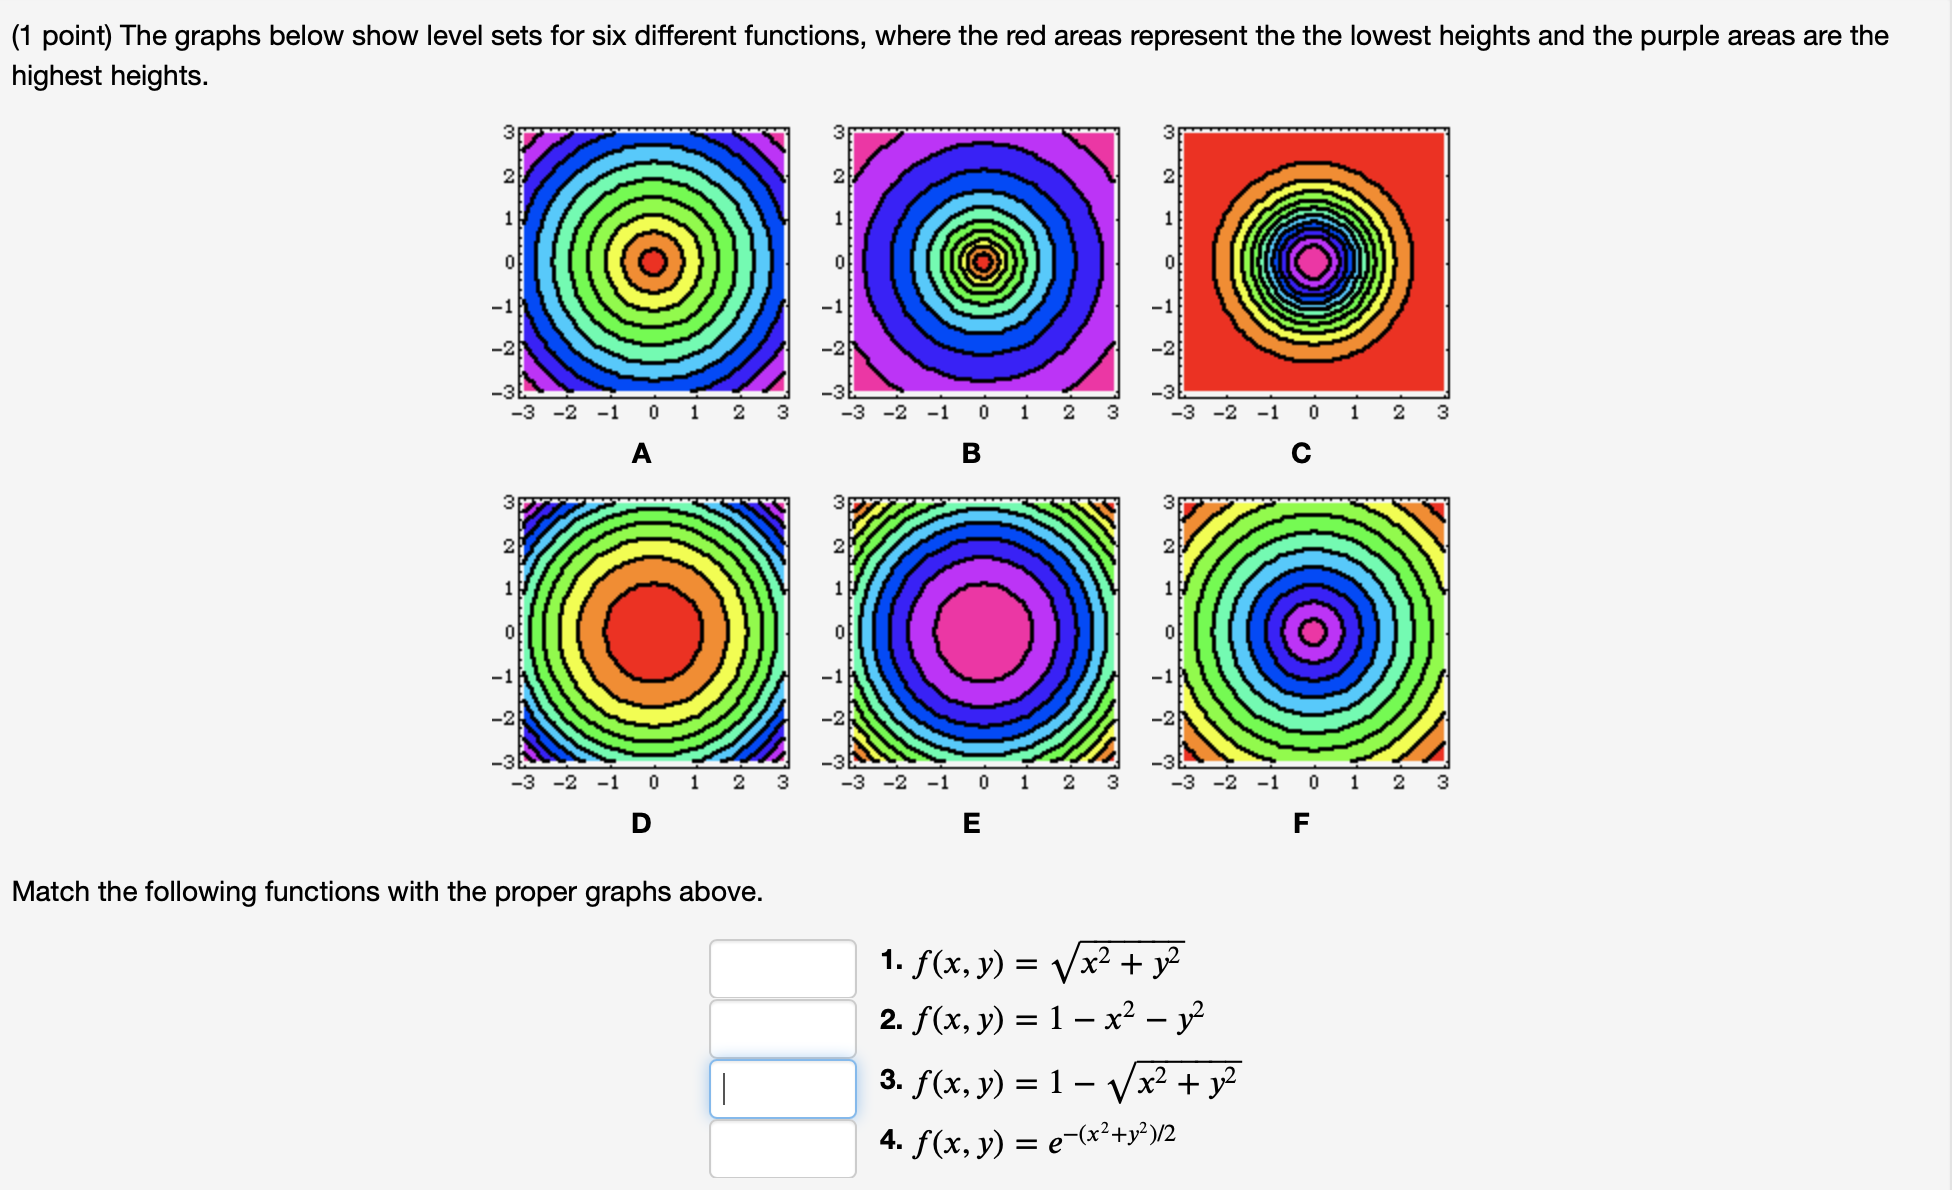
(1 point) The graphs below show level sets for six different functions, where the red areas represent the the lowest heights and the purple areas are the highest heights. L -2 -3 -3L -3 -3 -2 -1 0 1 2 3 -3 -2 -1 0 1 2 3 -3 -2 -1 0 1 2 3 A B C 3F -3A -3 -2 -1 0 2 -2 -1 0 1 2 -2 0 1 2 D E F Match the following functions with the proper graphs above. 1. f (x, y ) = Vx2+ 12 2. f(x, y) = 1 - x2 - yz 3. f(x, y) = 1 - Vx2 + 12 4. f ( x, y) = e-(x2 +y?) /2
Step by Step Solution
There are 3 Steps involved in it
1 Expert Approved Answer
Step: 1 Unlock

Question Has Been Solved by an Expert!
Get step-by-step solutions from verified subject matter experts
Step: 2 Unlock
Step: 3 Unlock