

Question: (1 point) The table below shows item weights (oz.) for 5 samples of 6 items Calculate the following statistics for x-bar and R charts
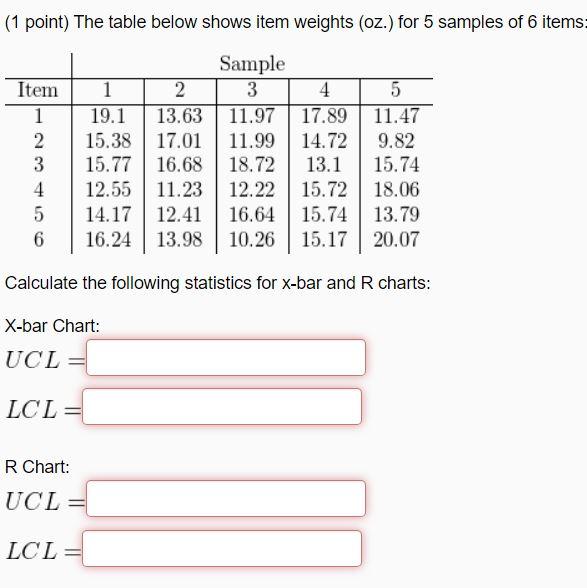
(1 point) The table below shows item weights (oz.) for 5 samples of 6 items Calculate the following statistics for x-bar and R charts
Step by Step Solution
There are 3 Steps involved in it
1 Expert Approved Answer
Step: 1 Unlock

Question Has Been Solved by an Expert!
Get step-by-step solutions from verified subject matter experts
Step: 2 Unlock
Step: 3 Unlock