

Question: A manager wishes to build a range chart for a process. The sample size is five, the mean of the sample means is 16.01,
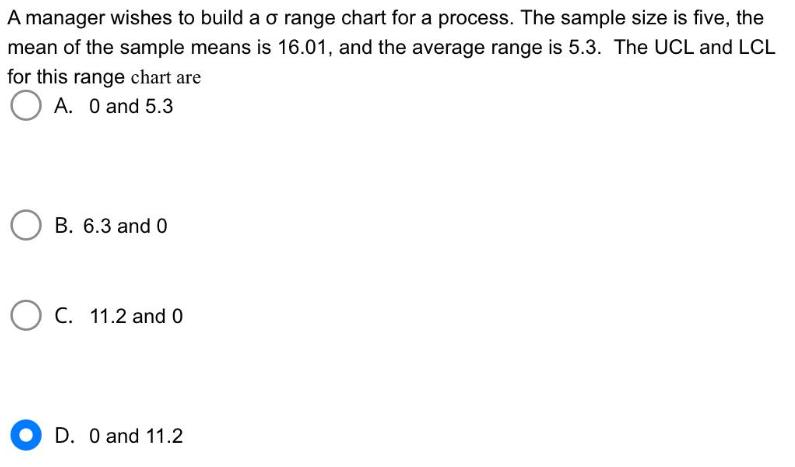
A manager wishes to build a range chart for a process. The sample size is five, the mean of the sample means is 16.01, and the average range is 5.3. The UCL and LCL for this range chart are A. 0 and 5.3 B. 6.3 and 0 C. 11.2 and 0 D. 0 and 11.2
Step by Step Solution
There are 3 Steps involved in it
1 Expert Approved Answer
Step: 1 Unlock

The detailed answer for the above question is provided below The image you provided shows a multiplechoice question concerning the calculation of the ... View full answer
Question Has Been Solved by an Expert!
Get step-by-step solutions from verified subject matter experts
Step: 2 Unlock
Step: 3 Unlock