

Question: 1. prepare a check sheet Apply the motor assembly data from above to the following four pictures Which of the following charts best represents this
1. prepare a check sheet
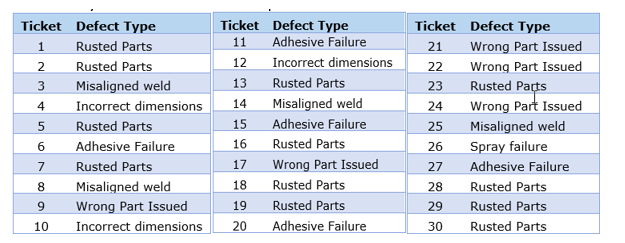
Apply the motor assembly data from above to the following four pictures
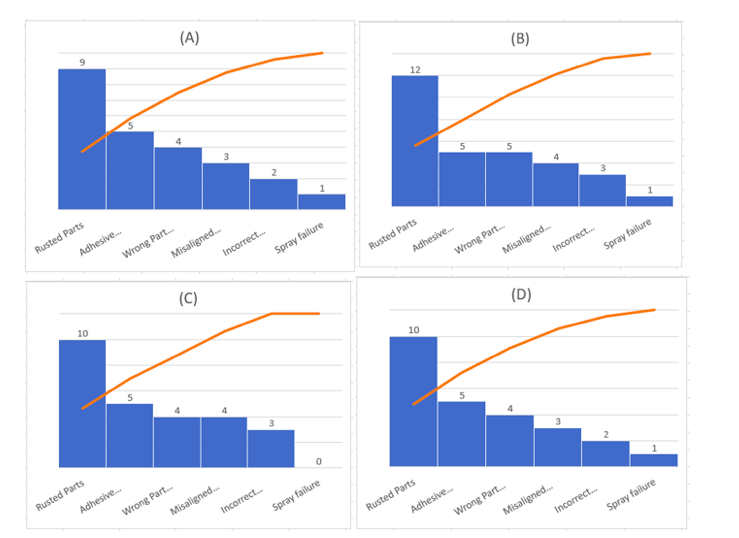
Which of the following charts best represents this data?
Based on the four pictures, these are all examples of:
a. histogram
b. run chart
c. scatter plot
d. Pareto
Ticket Defect Type 1 Rusted Parts 2 Rusted Parts 3 Misaligned weld 4 Incorrect dimensions 5 Rusted Parts 6 Adhesive Failure 7 Rusted Parts 8 Misaligned weld 9 Wrong Part Issued 10 Incorrect dimensions Ticket Defect Type 11 Adhesive Failure 12 Incorrect dimensions 13 Rusted Parts 14 Misaligned weld 15 Adhesive Failure 16 Rusted Parts 17 Wrong Part Issued 18 Rusted Parts 19 Rusted Parts 20 Adhesive Failure Ticket Defect Type 21 Wrong Part Issued 22 Wrong Part Issued 23 Rusted Parts 24 Wrong Part Issued 25 Misaligned weld 26 Spray failure 27 Adhesive Failure 28 Rusted Parts 29 Rusted Parts 30 Rusted Parts (A) (B) 12 2 Rusted Parts Adhesive... Rusted Parts Spray failure Incorrect... Adhesive... Wrong Part... Misaligned. Wrong Part Misaligned. Incorrect... Spray failure (C) (D) 10 10 2 0 Incorrect... Spray failure Rusted Parts Adhesive. Rusted Parts hesive Wrong Part... Misaligned. Wrong Part... Misaligned. Incorrect... Spray failureStep by Step Solution
There are 3 Steps involved in it
1 Expert Approved Answer
Step: 1 Unlock

Question Has Been Solved by an Expert!
Get step-by-step solutions from verified subject matter experts
Step: 2 Unlock
Step: 3 Unlock