

Question: 1. Prepare a scattergraph plot. (Place car wash costs on the vertical axis and rental returns on the horizontal axis.) Instructions: 1. On the graph
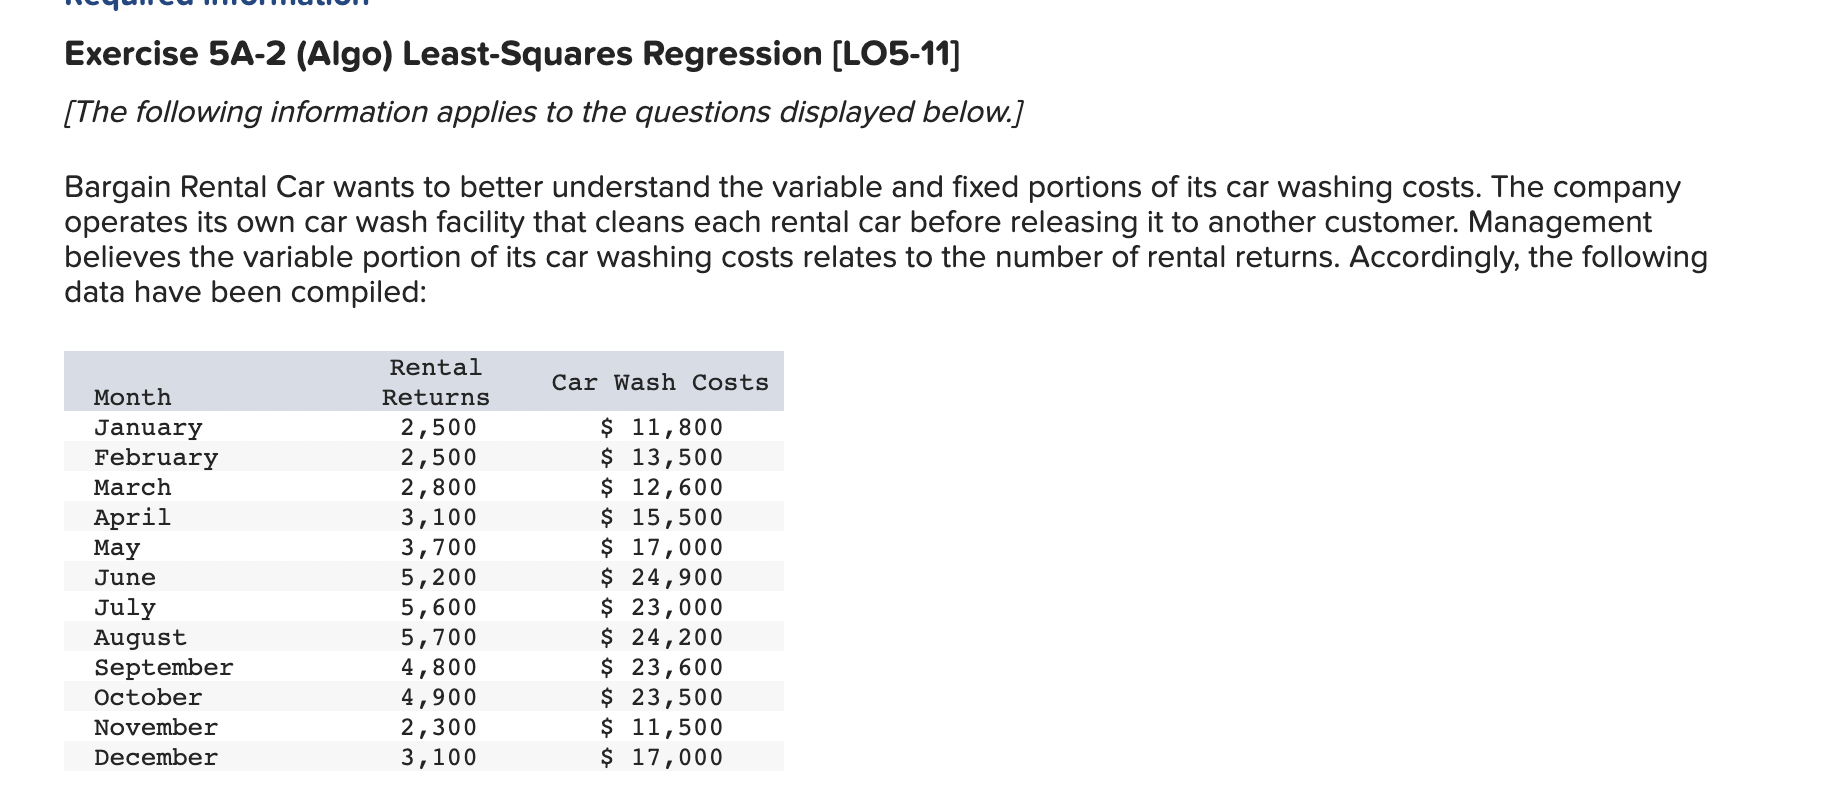
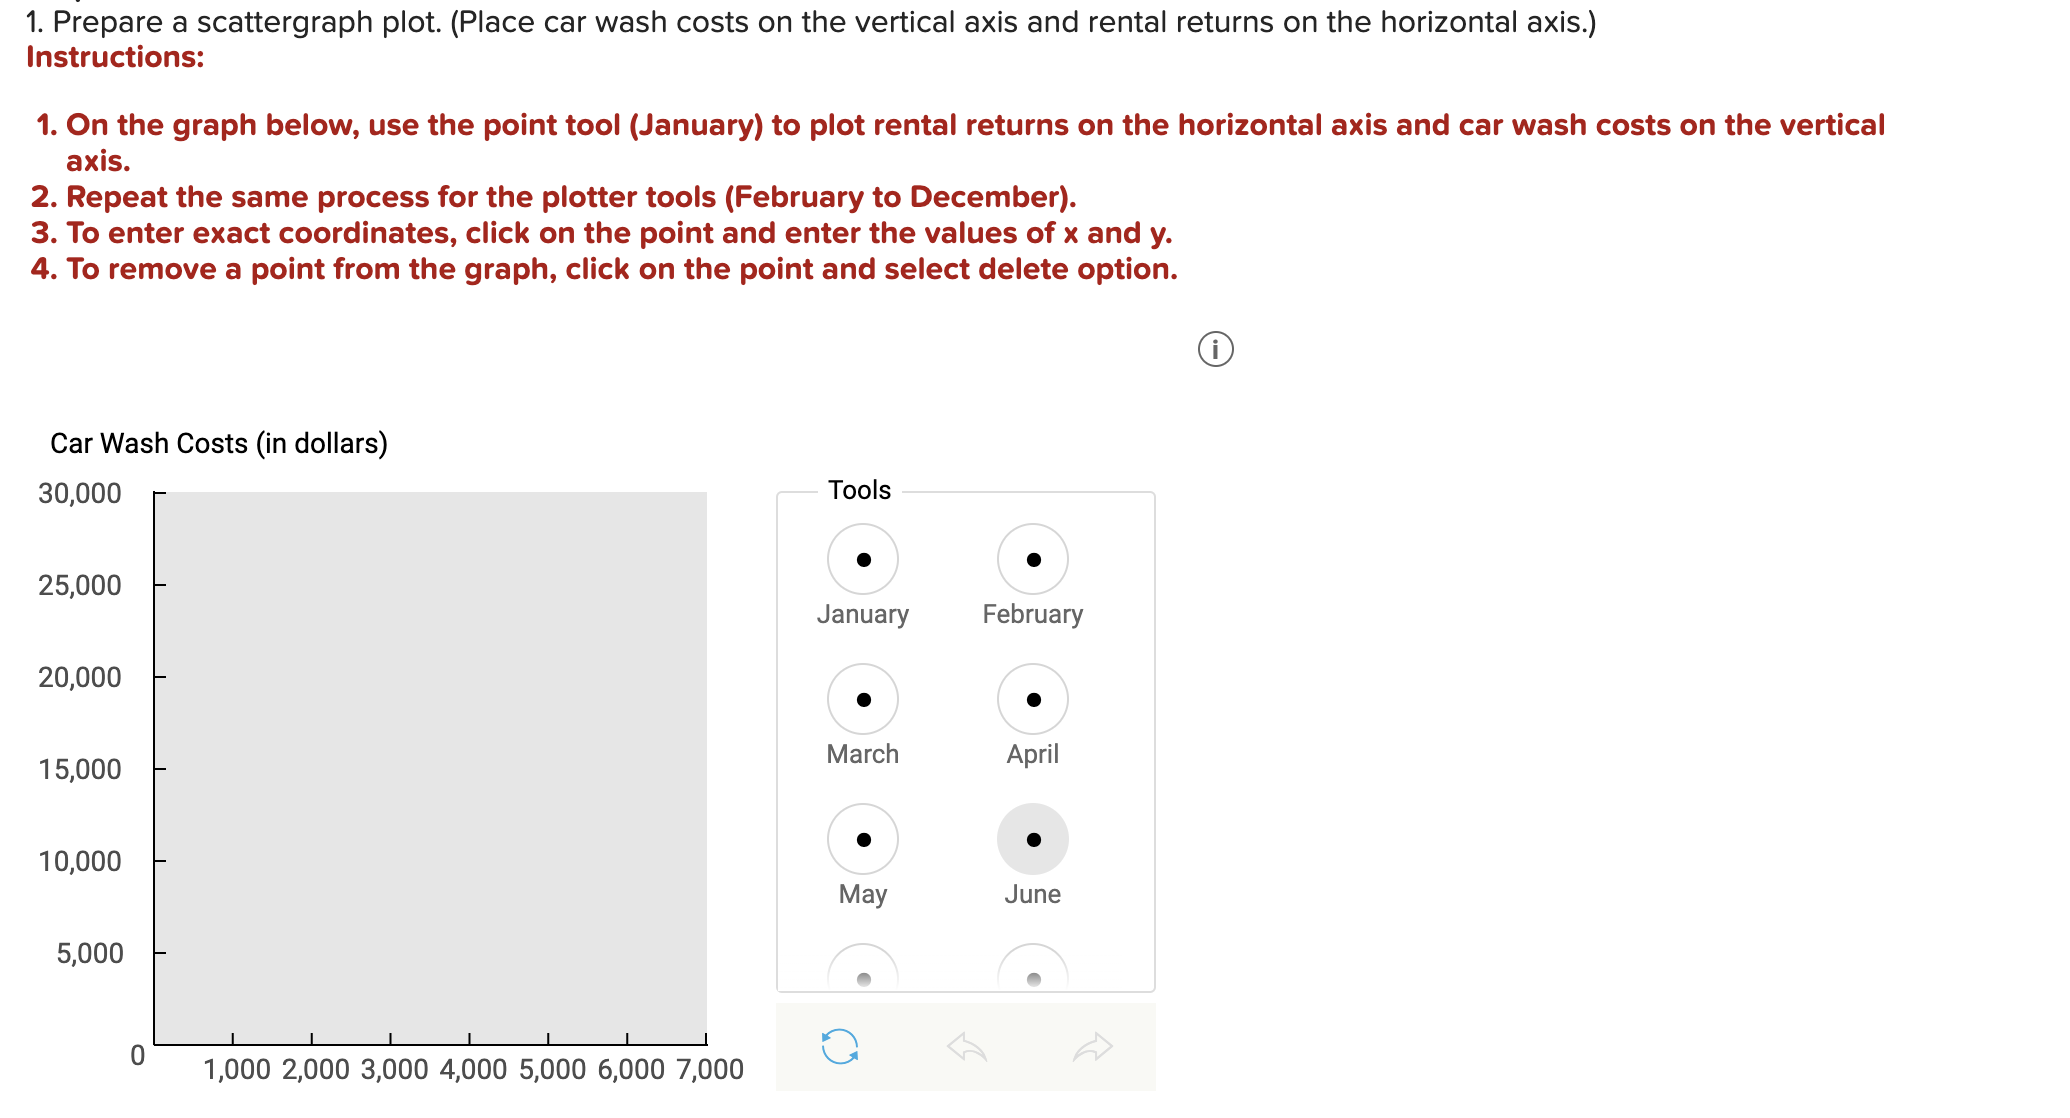
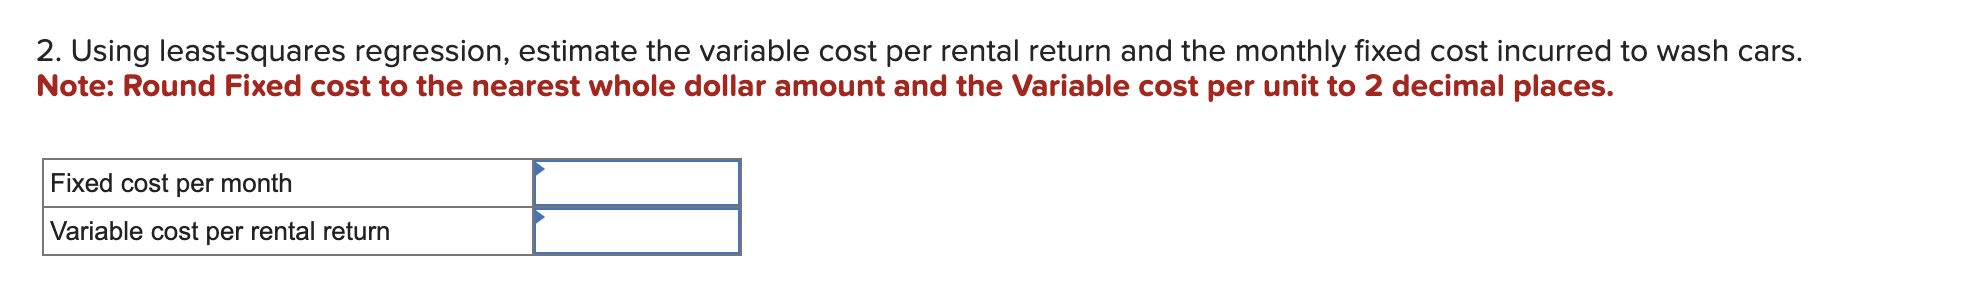
1. Prepare a scattergraph plot. (Place car wash costs on the vertical axis and rental returns on the horizontal axis.) Instructions: 1. On the graph below, use the point tool (January) to plot rental returns on the horizontal axis and car wash costs on the vertical axis. 2. Repeat the same process for the plotter tools (February to December). 3. To enter exact coordinates, click on the point and enter the values of x and y. 4. To remove a point from the graph, click on the point and select delete option. 2. Using least-squares regression, estimate the variable cost per rental return and the monthly fixed cost incurred to wash cars. Note: Round Fixed cost to the nearest whole dollar amount and the Variable cost per unit to 2 decimal places. 1. Prepare a scattergraph plot. (Place car wash costs on the vertical axis and rental returns on the horizontal axis.) Instructions: 1. On the graph below, use the point tool (January) to plot rental returns on the horizontal axis and car wash costs on the vertical axis. 2. Repeat the same process for the plotter tools (February to December). 3. To enter exact coordinates, click on the point and enter the values of x and y. 4. To remove a point from the graph, click on the point and select delete option. 2. Using least-squares regression, estimate the variable cost per rental return and the monthly fixed cost incurred to wash cars. Note: Round Fixed cost to the nearest whole dollar amount and the Variable cost per unit to 2 decimal places
Step by Step Solution
There are 3 Steps involved in it

Get step-by-step solutions from verified subject matter experts