

Question: 1. Problem #2.2, textbook, page 36 ( 0.5 point) 2. Problem #2.15, page 45(0.5 point) 3. Problem # 2.38, page 58(0.5 point) 4. Problem #
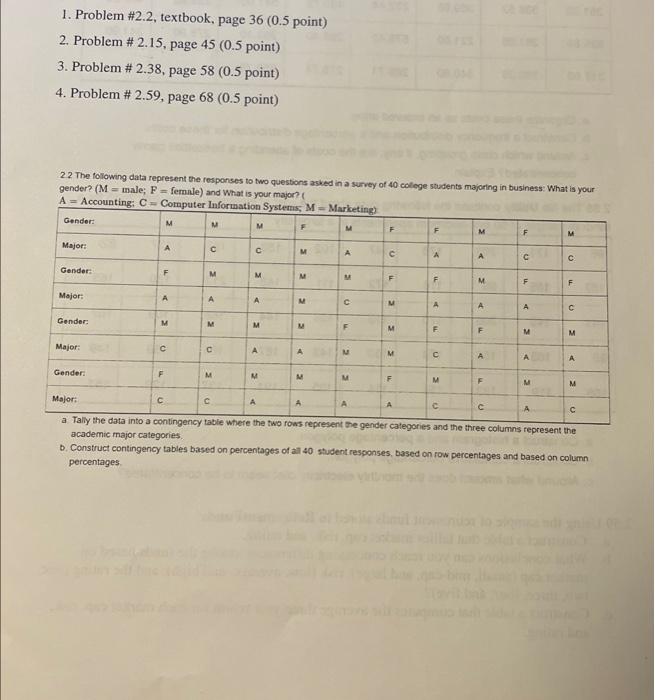
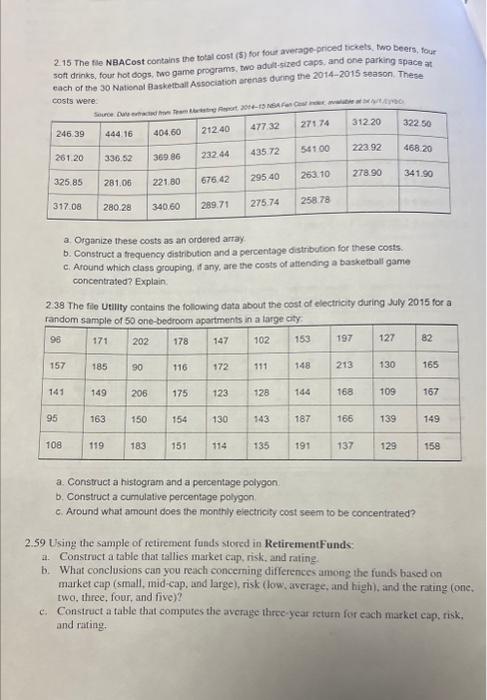
1. Problem #2.2, textbook, page 36 ( 0.5 point) 2. Problem #2.15, page 45(0.5 point) 3. Problem # 2.38, page 58(0.5 point) 4. Problem # 2.59, page 68(0.5 point ) 22 The following data represent the responses to two questions asked in a survey of 40 colloge sodents majoring in business: What is your gender? ( M= male; F= fermnle) and What is your major? ( academic major categories. b. Construct contingency tables based on percentages of al 40 student responses, based on row percentages and based on column percentages. 215 The the NBACost contains the total cost (5) for four average-pnced tickets, Wo beers, four soft drinks, four hot dogs, two game programs, two aduit-sized caps, and one parking space at each of the 30 National Basketball Association arenas during the 2014-2015 season. These costs were. a. Organize these costs as an ordered array. b. Construct a trequency distribution and a percentage distributon for these costs. c. Around which class grouping, \& any, are the costs of attenang a basketball game cancentrated? Explain. 2.38 The file Utility contains the following data about the cost of electricify during July 2015 for a random samole of 50 ana-hmernam anartments in a targe city: a. Construct a histogram and a percentage polygon. b. Construct a cumulative percentage polygon c. Around what amount does the monthly electricity cost seem to be concentrated? 2.59 Using the sample of retirement fuads stored in RetirementFunde: a. Construct a table that tallies market cap, risk, and rating. b. What conclusions can you reach concerning differences among the funck based on market cap (small, mid-cap, and large), risk (low, average, and high), and the rating (one. two, three, four, and five)? c. Construct a fable that computes the average threc-year feturn for each market cap, rink. and rafing. d. Drill down to examine the large cap funds that are high risk with a rating of three. How many funds are there? What conclusions can you reach about these funds? 1. Problem #2.2, textbook, page 36 ( 0.5 point) 2. Problem #2.15, page 45(0.5 point) 3. Problem # 2.38, page 58(0.5 point) 4. Problem # 2.59, page 68(0.5 point ) 22 The following data represent the responses to two questions asked in a survey of 40 colloge sodents majoring in business: What is your gender? ( M= male; F= fermnle) and What is your major? ( academic major categories. b. Construct contingency tables based on percentages of al 40 student responses, based on row percentages and based on column percentages. 215 The the NBACost contains the total cost (5) for four average-pnced tickets, Wo beers, four soft drinks, four hot dogs, two game programs, two aduit-sized caps, and one parking space at each of the 30 National Basketball Association arenas during the 2014-2015 season. These costs were. a. Organize these costs as an ordered array. b. Construct a trequency distribution and a percentage distributon for these costs. c. Around which class grouping, \& any, are the costs of attenang a basketball game cancentrated? Explain. 2.38 The file Utility contains the following data about the cost of electricify during July 2015 for a random samole of 50 ana-hmernam anartments in a targe city: a. Construct a histogram and a percentage polygon. b. Construct a cumulative percentage polygon c. Around what amount does the monthly electricity cost seem to be concentrated? 2.59 Using the sample of retirement fuads stored in RetirementFunde: a. Construct a table that tallies market cap, risk, and rating. b. What conclusions can you reach concerning differences among the funck based on market cap (small, mid-cap, and large), risk (low, average, and high), and the rating (one. two, three, four, and five)? c. Construct a fable that computes the average threc-year feturn for each market cap, rink. and rafing. d. Drill down to examine the large cap funds that are high risk with a rating of three. How many funds are there? What conclusions can you reach about these funds
Step by Step Solution
There are 3 Steps involved in it

Get step-by-step solutions from verified subject matter experts