

Question: 1 . Problems and Applications Q4 It is a hot day, and Bob is thirsty. Here is the value he places on a bottle of
1 . Problems and Applications Q4


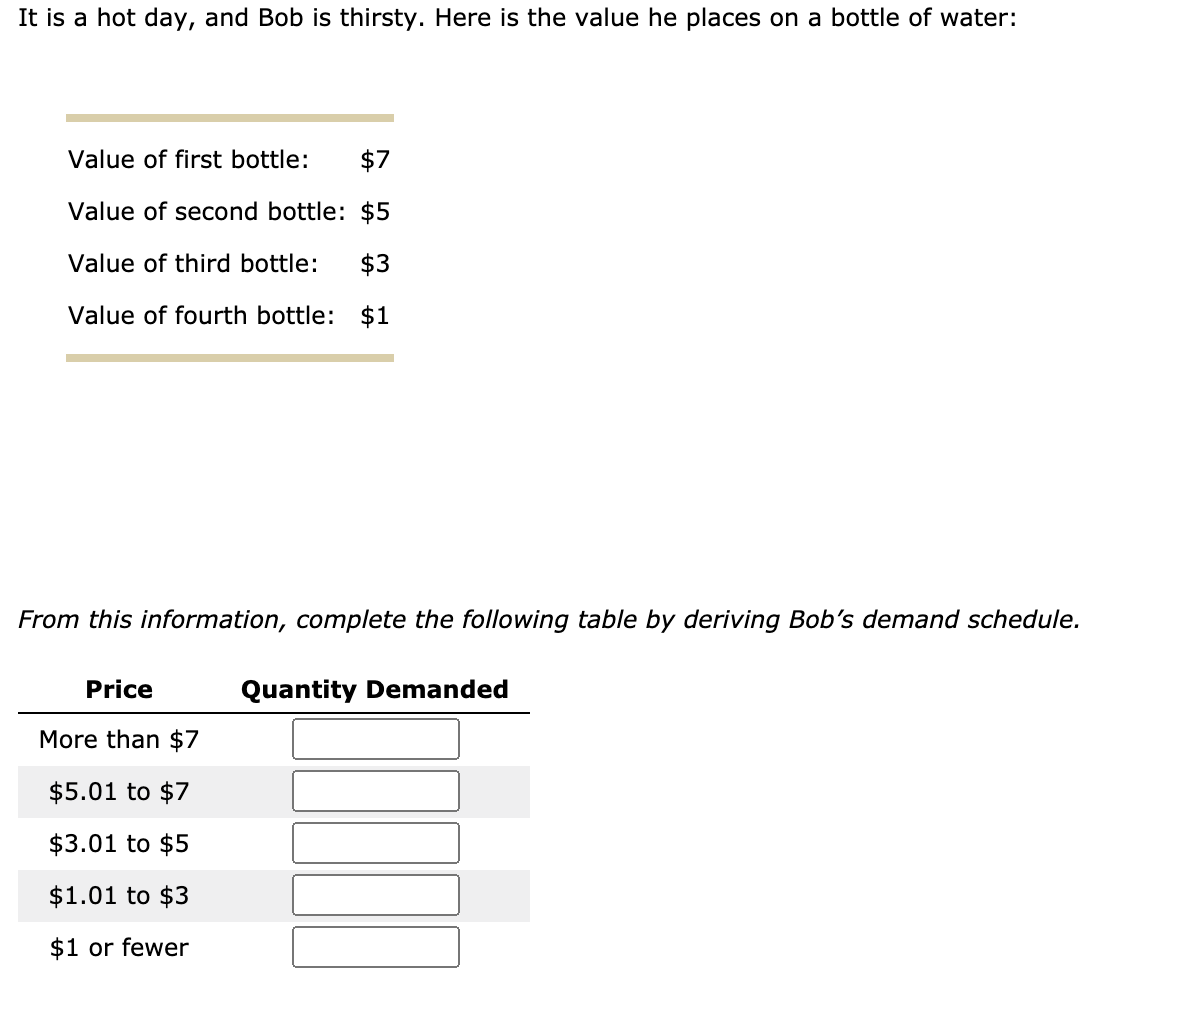
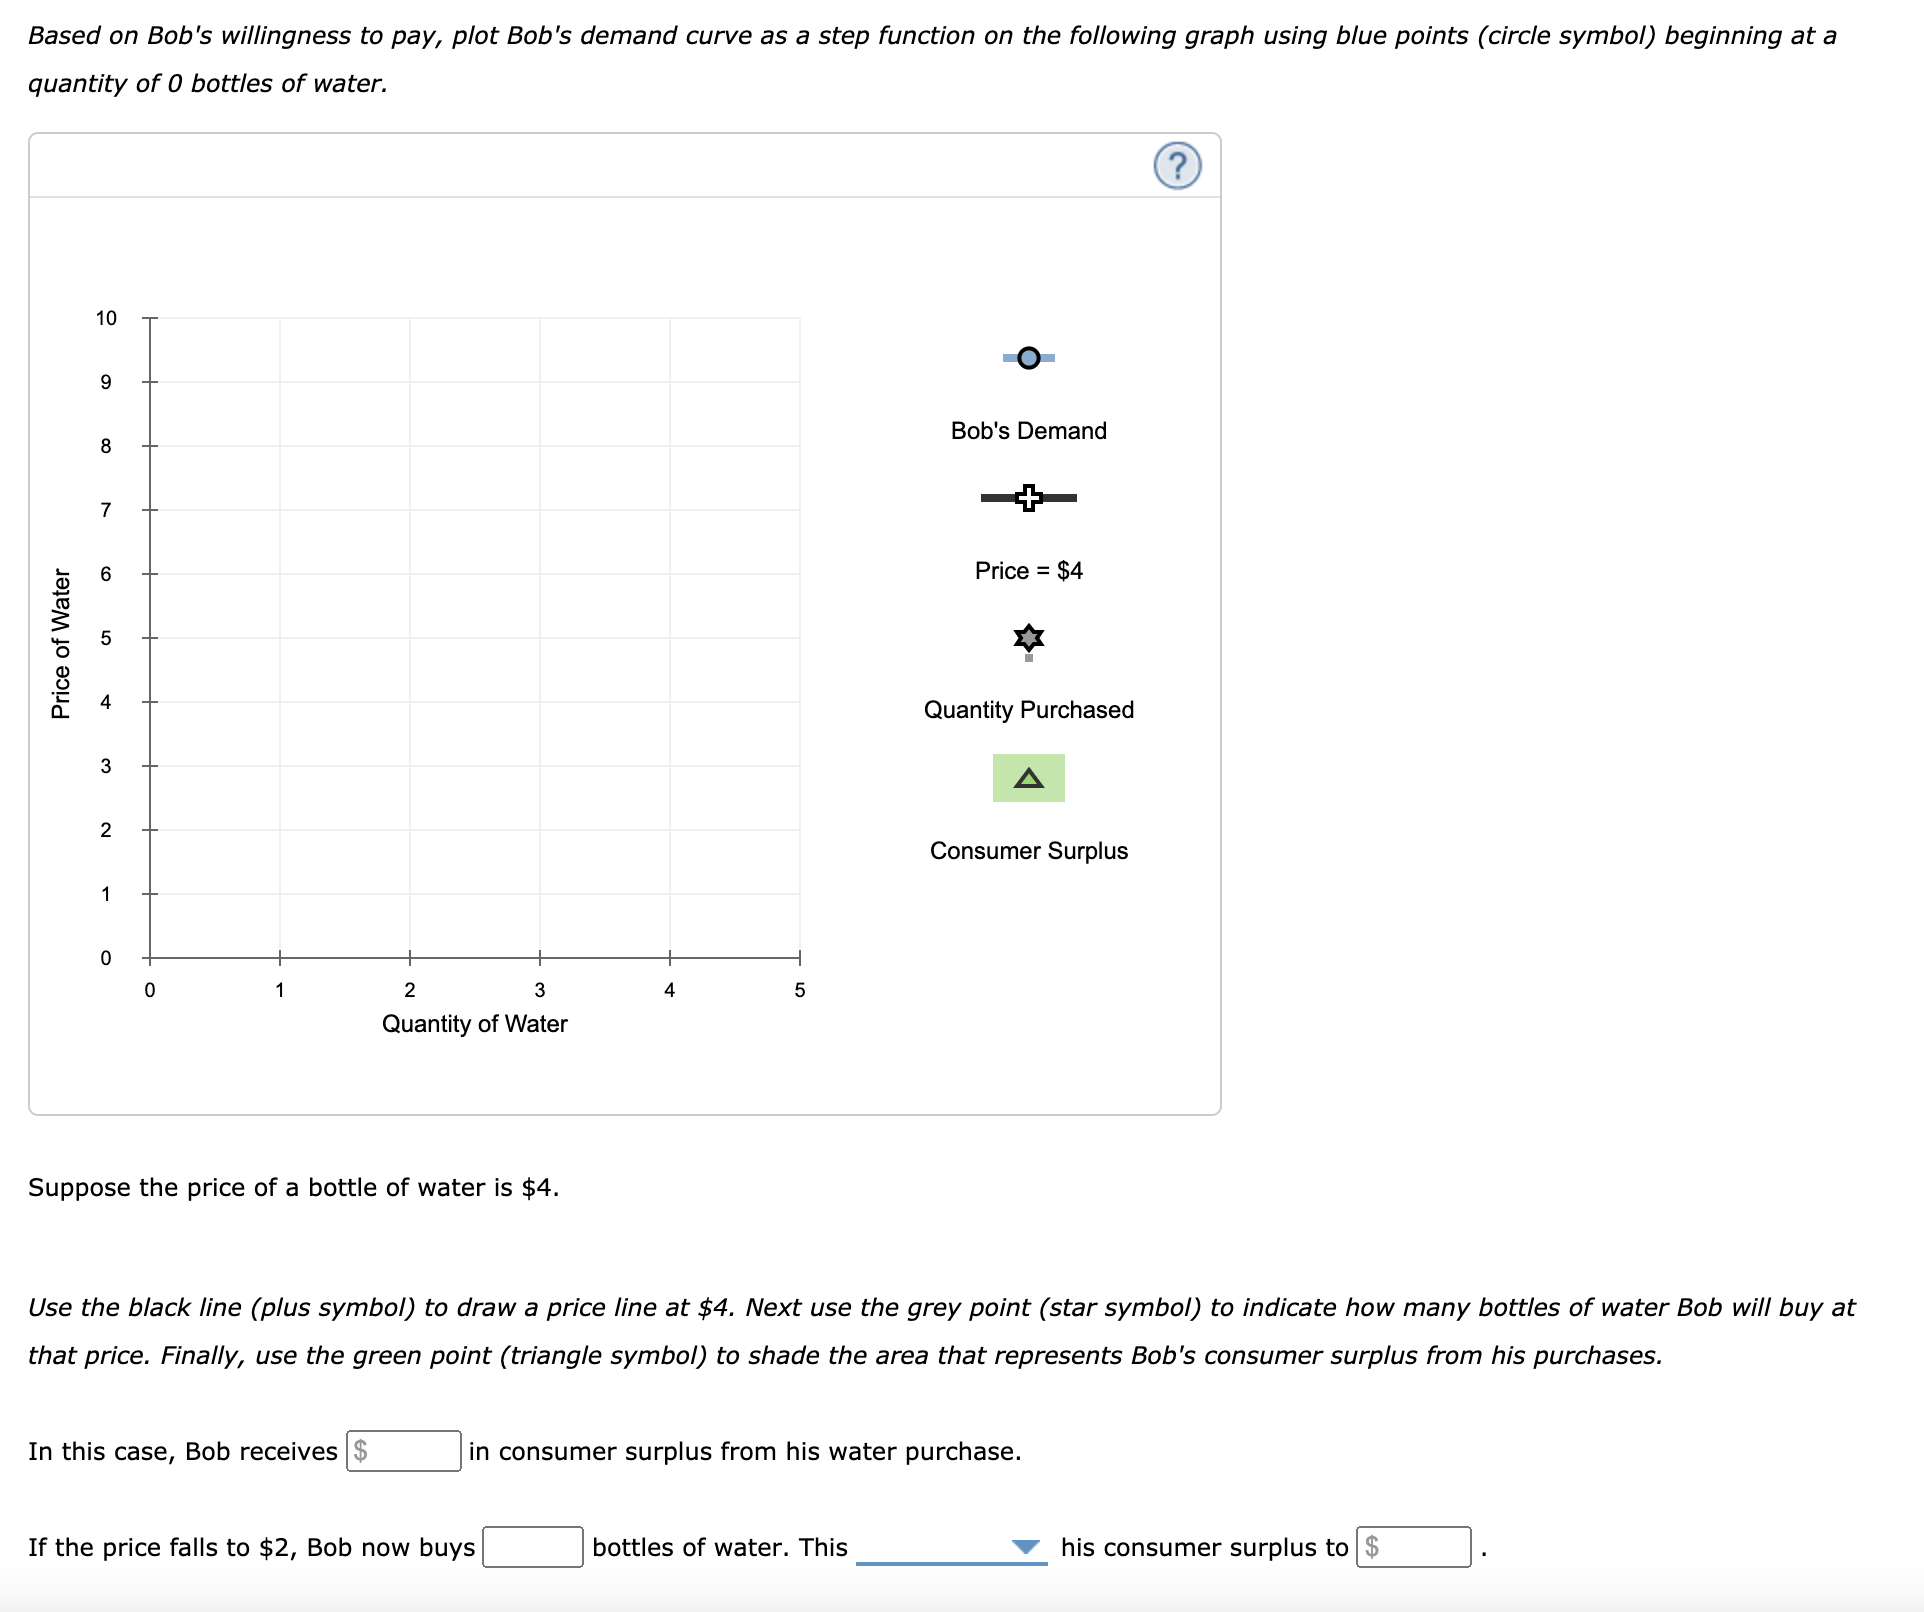
It is a hot day, and Bob is thirsty. Here is the value he places on a bottle of water: Value of first bottle: $7 Value of second bottle: $5 Value of third bottle: $3 Value of fourth bottle: $1 From this information, complete the following table by deriving Bob's demand schedule. Price Quantity Demanded More than $7 $5.01 to $7 $3.01 to $5 $1.01 to $3 $1 or fewerBased on Bob's willingness to pay, plot Bob's demand curve as a step function on the following graph using blue points ( circle symbol) beginning at a quantity of 0 bottles of water. -0- Bob's Demand 7 __ q? 6 Price = $4 5 i Price of Water Quantity Purchased 3 " A Consumer Surplus Quantity of Water Suppose the price of a bottle of water is $4. Use the black line (plus symbol) to draw a price line at $4. Next use the grey point (star symbol) to indicate how many battles of water Bob will buy at that price. Finally, use the green point (triangle symbol) to shade the area that represents Bob's consumer surplus from his purchases. In this case, Bob receives in consumer surplus from his water purchase. If the price falls to $2, Bob now buys bottles of water. This v his consumer surplus to $
Step by Step Solution
There are 3 Steps involved in it

Get step-by-step solutions from verified subject matter experts