

Question: 1. Project 1 and Project 2 have the cash-flows given in the table below 2. Project 1 and Project 2 have the cash-flows given in
1. Project 1 and Project 2 have the cash-flows given in the table below
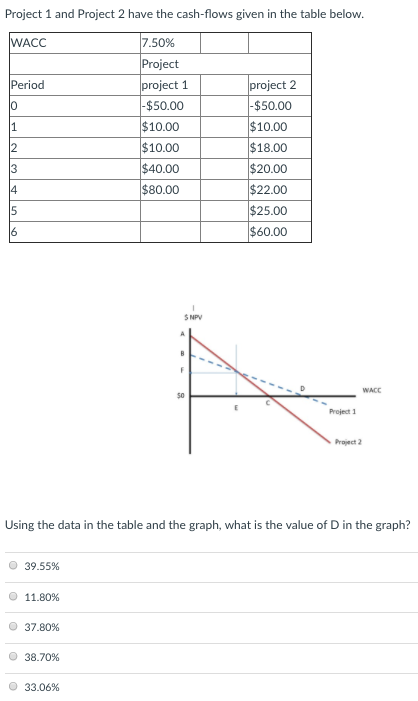
2. Project 1 and Project 2 have the cash-flows given in the table below.
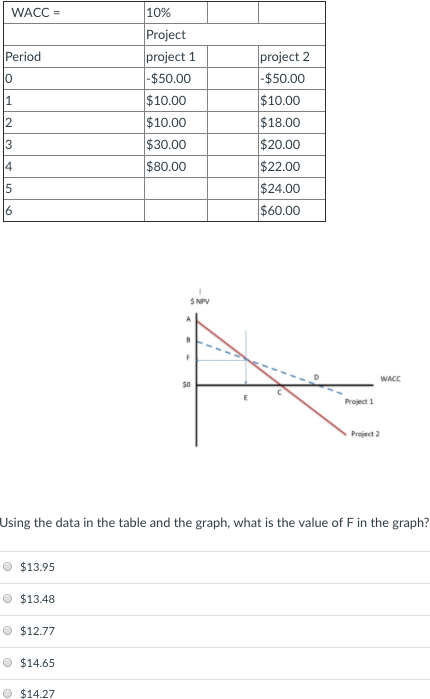
WACC = 10% Project project 1 $50.00 $10.00 $10.00 $30.00 $80.00 project 2 $50.00 $10.00 $18.00 $20.00 $22.00 $24.00 $60.00 Period 0 2 4 6 WACC 50 Project 1 Project 2 Using the data in the table and the graph, what is the value of F in the graph? O $13.95 O $13.48 $12.77 O $14.65 $14.27
Step by Step Solution
There are 3 Steps involved in it
1 Expert Approved Answer
Step: 1 Unlock

Question Has Been Solved by an Expert!
Get step-by-step solutions from verified subject matter experts
Step: 2 Unlock
Step: 3 Unlock