

Question: . 1. Project Overview . The activities in this project are designed to provide experience performing data analysis using Microsoft Excel 2016. . You will
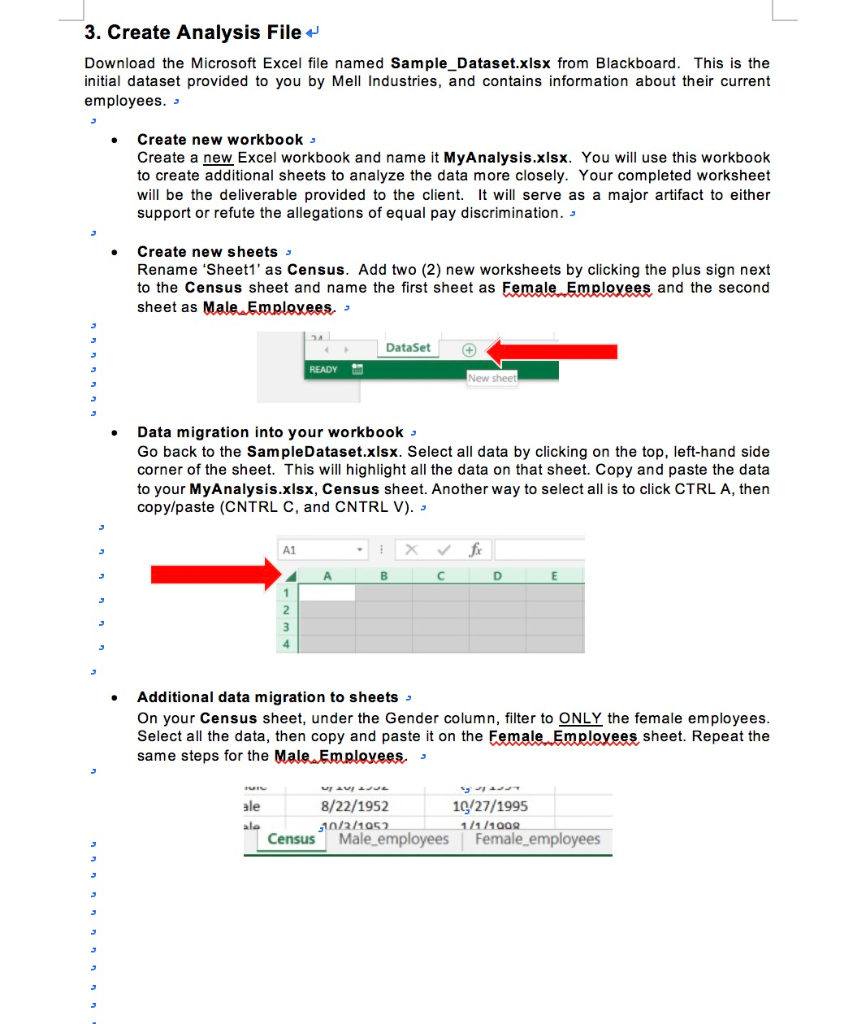
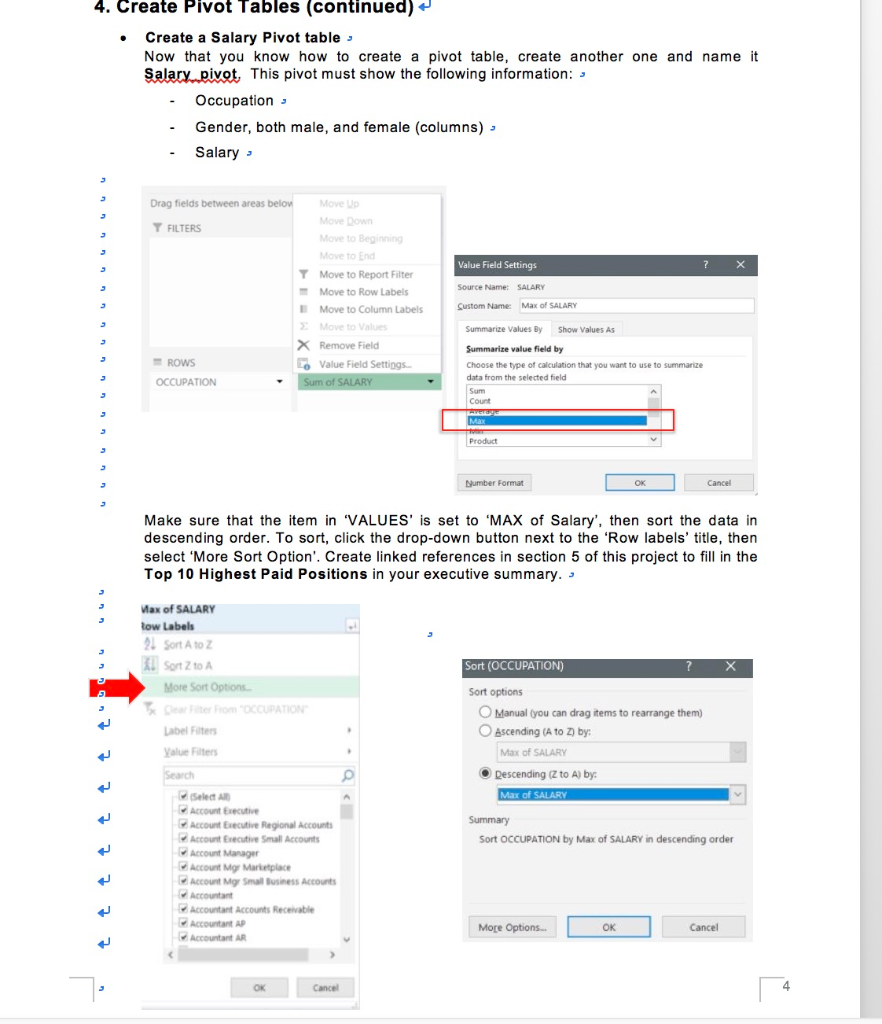

. 1. Project Overview . The activities in this project are designed to provide experience performing data analysis using Microsoft Excel 2016. . You will use assorted functions, calculations, and pivot tables in this project to evaluate employee data and also create an executive summary and visualization. - . 2. Company Background Mell Industries is a national manufacturing firm based in Chicago that specializes in textiles. Mell Industries started out as a small factory in Warrenville, Illinois and experienced steady growth over the past twenty-four years. In this time, Mell Industries opened warehouses and factories in the areas surrounding Michigan and Indianapolis, eventually moving their headquarters to Chicago. Mell Industries is at the peak of its growth cycle and seeks to improve its corporate risk management program. - In recent years, Mell Industries has been accused of equal pay discrimination. The accusation originated from a disgruntled employee who leaked sensitive payroll information to the media highlighting the pay disparity between her salary and the salary of a co-worker with the same title, time in grade, and equivalent work history and educational qualifications. Negative public perception can severely impact corporate accomplishments, market share and stock value. - 3 specific role the project Given the sensitivity of this issue, Mell Industries has hired Cal Poly Pomona to conduct an independent assessment using a sample set of 747 employee records. The company has also offered Cal Poly Pomona bonus compensation for any promising information provided. Mell Industries intends to use these findings to design business controls for ensuring equity in all pay scales and functional roles. These improvements will guide all future employee compensation reviews. The sample dataset has been given to you as an excel spreadsheet titled Sample_Dataset.xlsx consisting of data with the following 12 column headers. s Column A - Employee ID - Column B - Gender : . Column C - Date of Birth . Column D - Date of Hire Column E - Termination Dates . Column F - Occupation - Column G - Salary - Column H to L - Employee Evaluation Metrics Using columns H to L, you will complete a performance rating logic shown in section 7 of this project. The objective of this project is to complete all tasks and determine if allegations into equal pay discrimination have merits 3. Create Analysis File Download the Microsoft Excel file named Sample_Dataset.xlsx from Blackboard. This is the initial dataset provided to you by Mell Industries, and contains information about their current employees. - Create new workbooks Create a new Excel workbook and name it MyAnalysis.xlsx. You will use this workbook to create additional sheets to analyze the data more closely. Your completed worksheet will be the deliverable provided to the client. It will serve as a major artifact to either support or refute the allegations of equal pay discrimination. - Create new sheets Rename 'Sheet1' as Census. Add two (2) new worksheets by clicking the plus sign next to the Census sheet and name the first sheet as Female Employees and the second sheet as Male Employees, 24 DataSet READY New sheet Data migration into your workbooks Go back to the SampleDataset.xlsx. Select all data by clicking on the top, left-hand side corner of the sheet. This will highlight all the data on that sheet. Copy and paste the data to your MyAnalysis.xlsx, Census sheet. Another way to select all is to click CTRL A, then copy/paste (CNTRL C, and CNTRL V). - A1 A B D E Additional data migration to sheets On your Census sheet, under the Gender column, filter to ONLY the female employees. Select all the data, then copy and paste it on the Female Employees sheet. Repeat the same steps for the Male Employees. : ale UJUE 8/22/1952 1/27/1995 10/2/1052 1/1/100R Male_employees Female_employees ale Census 4. Create Pivot Tables (continued) Create a Salary Pivot tables Now that you know how to create a pivot table, create another one and name it Salary.pivot. This pivot must show the following information: 3 Occupation - Gender, both male, and female (columns) - - Salary - 3 Value Field Settings ? Drag fields between areas below Move Up Move Down Y Y FILTERS Move to Beginning Move to End Y Move to Report Filter - - Move to Row Labels Move to Column Labels Move to Values X Remove Field - ROWS Value Field Settings OCCUPATION Sum of SALARY Source Name: SALARY Custom Name: Max of SALARY 3 Summarize Values By Show Values As Summarire value field by Choose the type of calculation that you want to use to summarize data from the selected field Sum Count HUB Max Product Number Format OK Cancel Make sure that the item in 'VALUES' is set to 'MAX of Salary', then sort the data in descending order. To sort, click the drop-down button next to the 'Row labels' title, then select 'More Sort Option'. Create linked references in section 5 of this project to fill in the Top 10 Highest Paid Positions in your executive summary. - Sort (OCCUPATION) ? X Max of SALARY Row Labels 21 Sort A to Z Sort Z to A More Sort Options Site From OCCUPATION Label Filters Value Filters Search Sort options O Manual (you can drag items to rearrange them) O Ascending (A to Z) by: Max of SALARY Descending (Z to A) by: Max of SALARY - Summary Sort OCCUPATION by Max of SALARY in descending order Select Account Executive Account Executive Regional Accounts Account recutive Small Accounts Account Manager Account Mgr Marketplace Account Mgr Small Business Accounts Accountant Accountant Accounts Receivable Accountant AP Accountant AR More Options... OK Cancel OK Cancel 4 5. Create Executive Summary Create the layout shown below to summarize salary history analysis from the sample dataset file provided in this project. Be sure to match this formatting as much as possible. - Data Analysis - Create a new sheet named Data Analysis. Refer to Figure 1 and replicate this formatting to your Data Analysis sheet. Once you have accomplished this, populate the blank cells using appropriate functions. Below are helpful hints to support your effort. - To answer the Top 10 Highest Paid Positions section, pivot tables from section 4 of this project are required. Use linked references to populate results for male vs. female. PERCENTAGE MALE FEMALE AVERAGE SALARY MALE FEMALE DATA ANALYSIS SALARY COMPARISON REPORT Total number of male employees Total number of female employees Total number of employees SALARY BRACKET COUNT SALARY BRACKET MALE FEMALE $20,000 - $50,000 $50,001 - $100,000 $100,001 - $200,000 $200,001 - $300,000 $300,001 - 5400,000 AVERAGE SALARY BY OCCUPATION COUNT OCCUPATION MALE FEMALE Stocking Associate Inventory Retrieving Associate Customer Service Representative Category Manager TOP 10 HIGHEST PAID POSITIONS SALARY OCCUPATION MALE FEMALE Sr. VP Sales & Marketing Chief Legal Officer Corporate Legal Sr. VP Operations Chairman Holding General Counsel CFO NA Region VP International VP Marketplace VP Admin Sales and Mktg Sr Dir Corporate Engineer Figure 1 - Data Analysis (Executive Summary) - Important Note: To receive full credit, Excel functions must be used for each required field in the data analysis. This means that no hard-coded numbers should show in the formula bar. . Helpful Hints Total number of male employees: =COUNTIF Total number of female employees: ECOUNTIF Total number of employees: =SUM Male/Female count: ECOUNTIFS, [e.g., COUNTIFS(range,">=X",range,"=X",range,"
Step by Step Solution
There are 3 Steps involved in it
It looks like you uploaded multiple images of a project document related to employee data analysis and pay equity evaluation using Excel Below is a structured response based on the document Project Ov... View full answer

Get step-by-step solutions from verified subject matter experts