

Question: 1. Provide the results table, including the coefficients, standard errors, p-values, and confidence intervals. Y is age continuous X is experience continuous SUMMARY OUTPUT
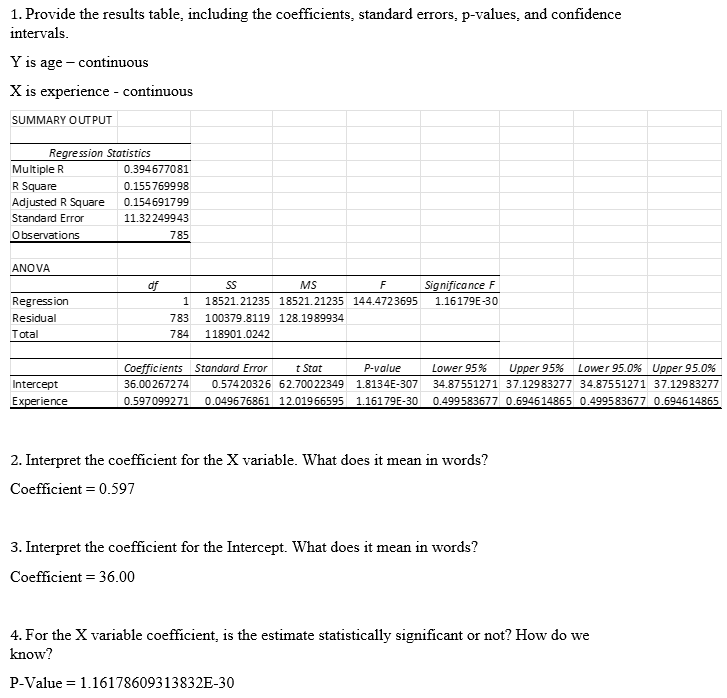
1. Provide the results table, including the coefficients, standard errors, p-values, and confidence intervals. Y is age continuous X is experience continuous SUMMARY OUTPUT Regression Statistics Multiple R 0.394677081 R Square 0.155769998 Adjusted R Square 0.154691799 Standard Error 11.32249943 Observations 785 ANOVA df SS MS F Regression 1 18521.21235 18521.21235 144.4723695 Significance F 1.16179E-30 Residual Total 783 100379.8119 128.1989934 784 118901.0242 Coefficients Standard Error t Stat Intercept Experience 36.00267274 0.597099271 P-value 0.57420326 62.70022349 1.8134E-307 0.049676861 12.01966595 1.16179E-30 Lower 95% Upper 95% Lower 95.0% Upper 95.0% 34.87551271 37.12983277 34.87551271 37.12983277 0.499583677 0.694614865 0.499583677 0.694614865 2. Interpret the coefficient for the X variable. What does it mean in words? Coefficient = 0.597 3. Interpret the coefficient for the Intercept. What does it mean in words? Coefficient = 36.00 4. For the X variable coefficient, is the estimate statistically significant or not? How do we know? P-Value = 1.16178609313832E-30
Step by Step Solution
There are 3 Steps involved in it

Get step-by-step solutions from verified subject matter experts