

Question: 1 pts By graphing this function, it can be determined that the graph of the function p(x) -*+ 6x2+ 11x + 6 will have an

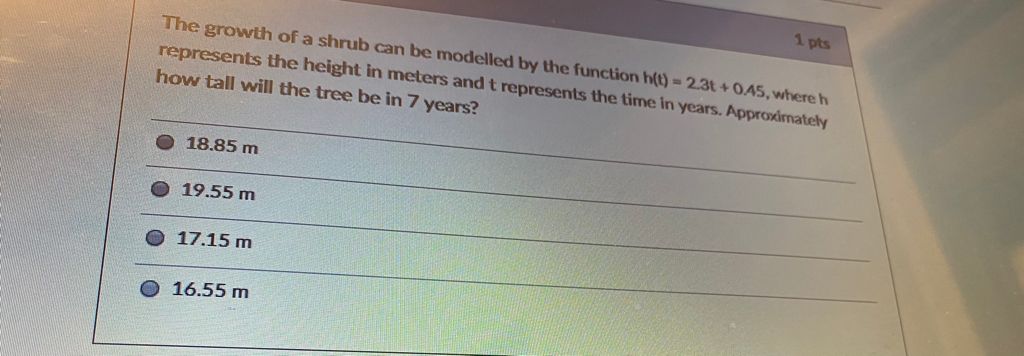
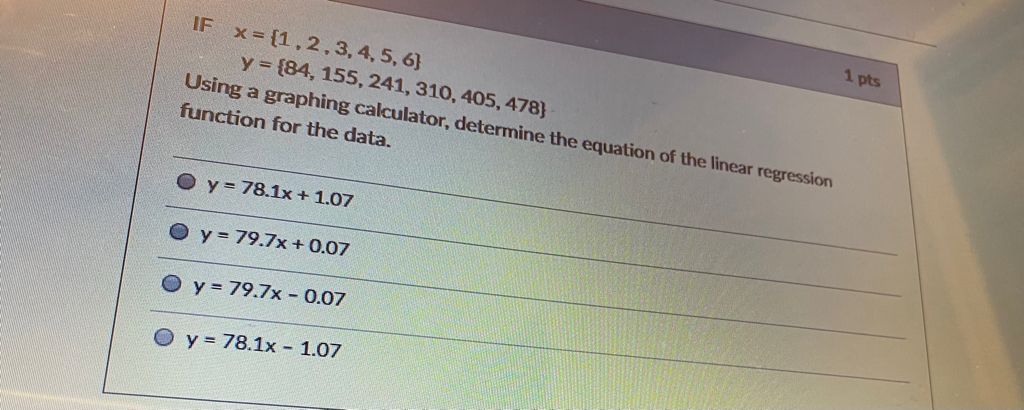
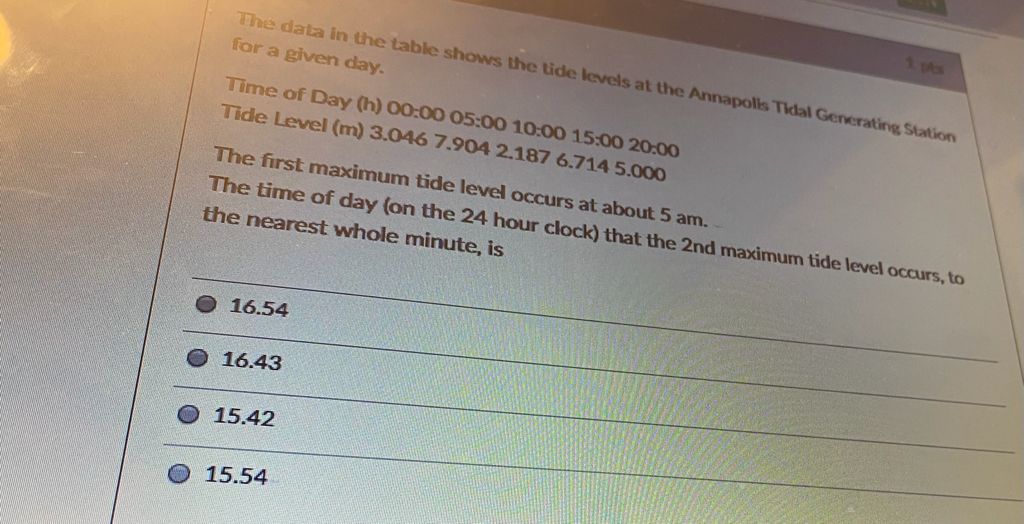
1 pts By graphing this function, it can be determined that the graph of the function p(x) -*+ 6x2+ 11x + 6 will have an x-intercept at: 02 0 3 0-11 pts The growth of a shrub can be modelled by the function h(t) = 2.3t +0.45, where h represents the height in meters and t represents the time in years. Approximately how tall will the tree be in 7 years? O 18.85 m 19.55 m 17.15 m 16.55 m1 pts IF x = [1, 2, 3, 4, 5, 6] y = (84, 155, 241, 310, 405, 478} Using a graphing calculator, determine the equation of the linear regression function for the data. O y= 78.1x + 1.07 O y= 79.7x + 0.07 O y = 79.7x - 0.07 O y = 78.1x - 1.07The data in the table shows the tide levels at the Annapolis Tidal Generating Station for a given day. Time of Day (h) 00:00 05:00 10:00 15:00 20:00 Tide Level (m) 3.046 7.904 2.187 6.714 5.000 The first maximum tide level occurs at about 5 am. The time of day (on the 24 hour clock) that the 2nd maximum tide level occurs, to the nearest whole minute, is O 16.54 O 16.43 15.42 15.54
Step by Step Solution
There are 3 Steps involved in it

Get step-by-step solutions from verified subject matter experts