

Question: 1. Pull Financial Data for Tier 1 Suppliers 2. Analyze Marketing Data for Retail Group 3. Run Analysis and Remove Outliers for Customer 4.
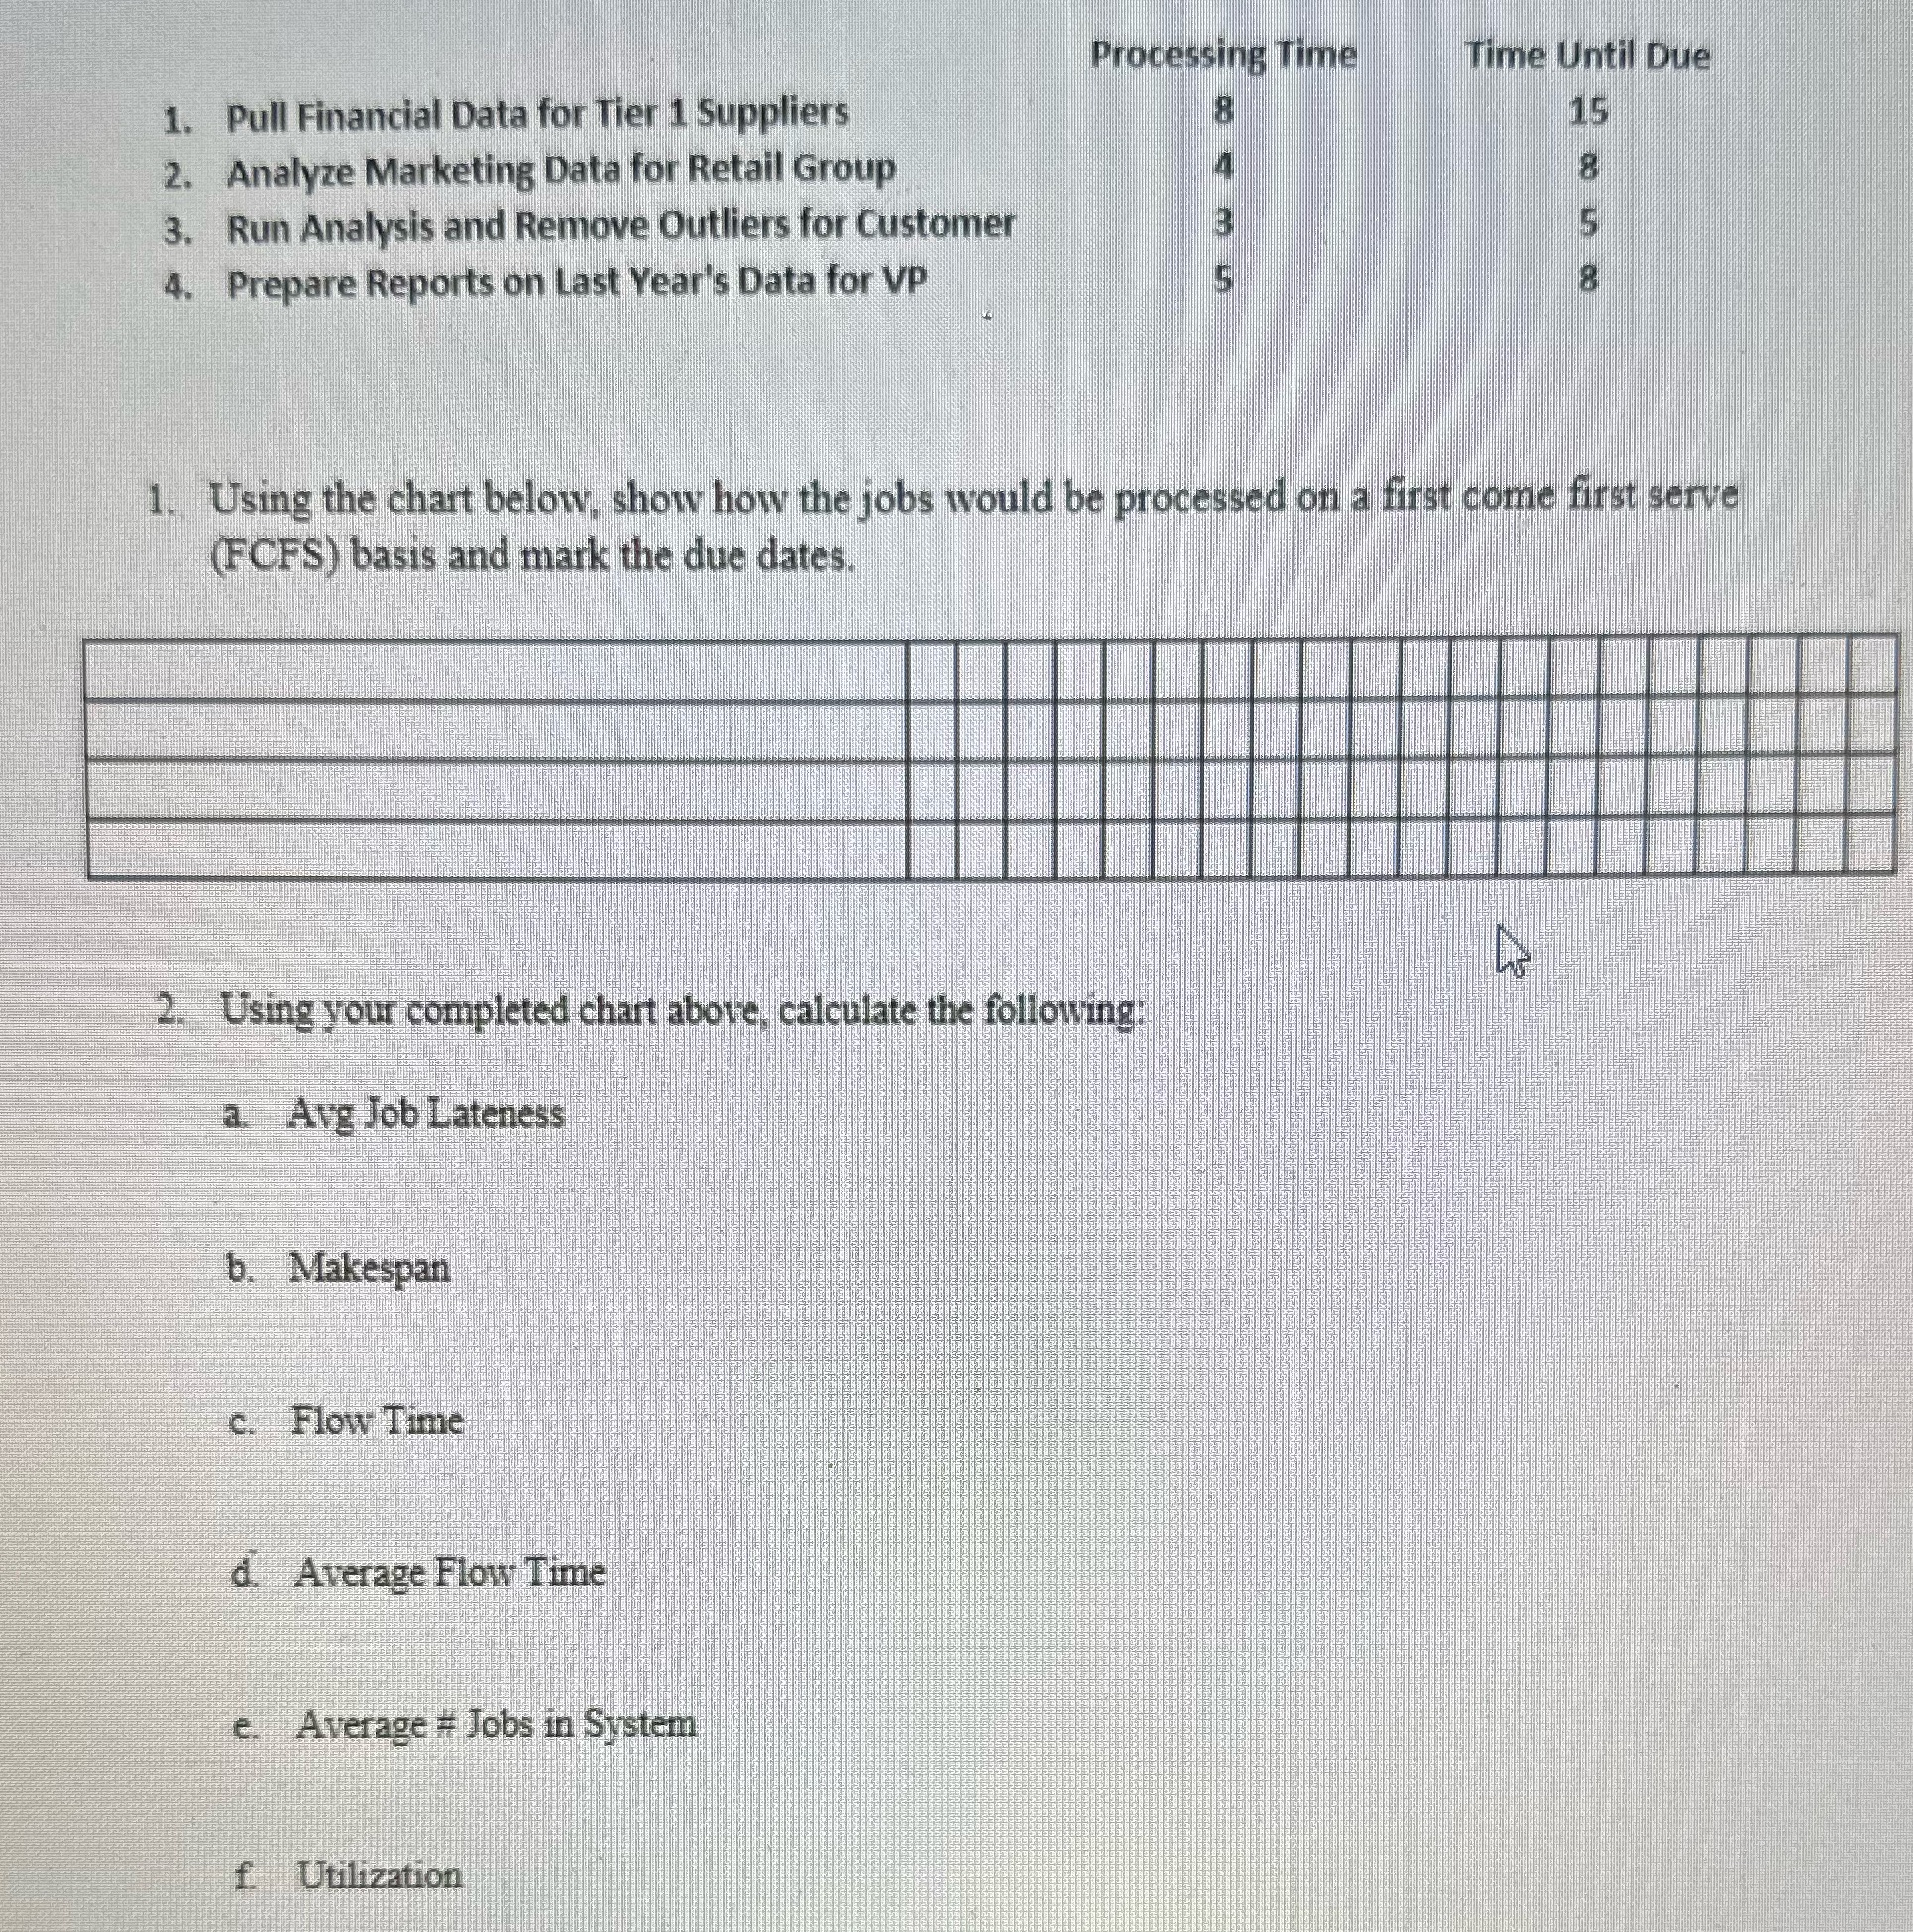
1. Pull Financial Data for Tier 1 Suppliers 2. Analyze Marketing Data for Retail Group 3. Run Analysis and Remove Outliers for Customer 4. Prepare Reports on Last Year's Data for VP Processing Time 8 Time Until Due 15 5 1. Using the chart below, show how the jobs would be processed on a first come first serve (FCFS) basis and mark the due dates. 2. Using your completed chart above, calculate the following: a. Avg Job Lateness b. Makespan c. Flow Time d. Average Flow Time e. Average # Jobs in System f Utilization D
Step by Step Solution
There are 3 Steps involved in it
1 Expert Approved Answer
Step: 1 Unlock

Question Has Been Solved by an Expert!
Get step-by-step solutions from verified subject matter experts
Step: 2 Unlock
Step: 3 Unlock