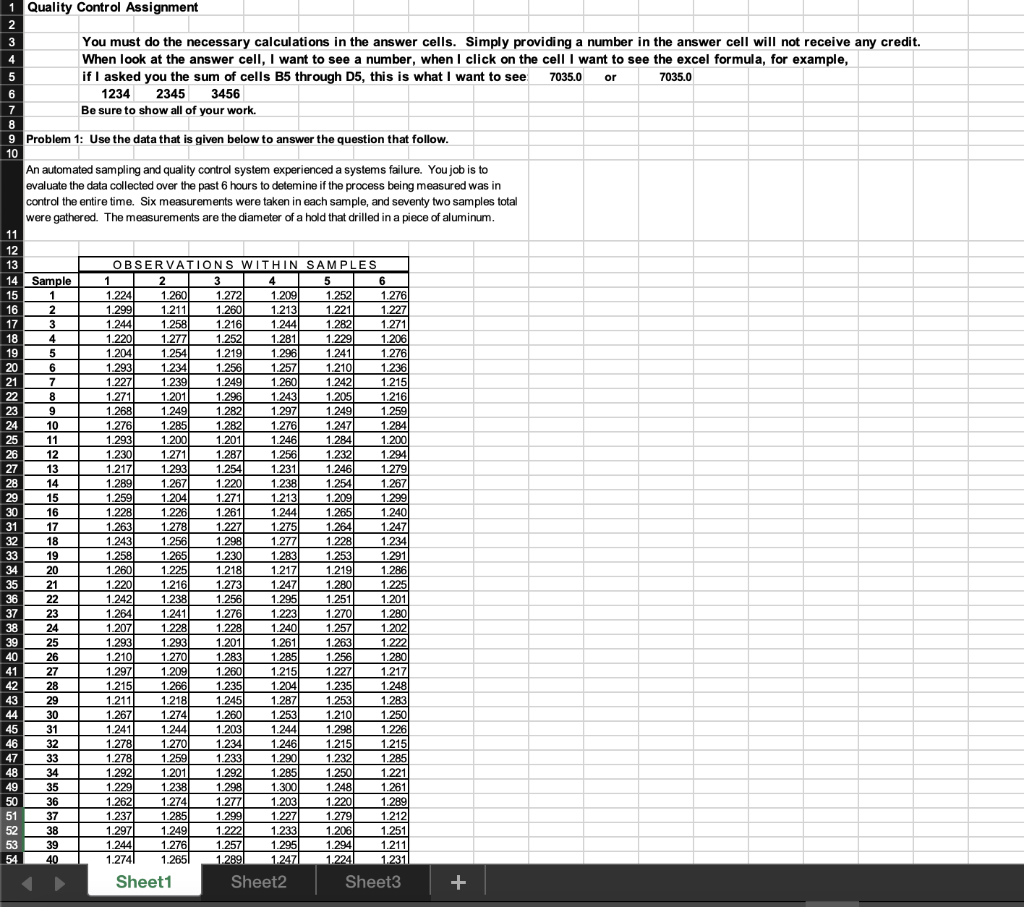
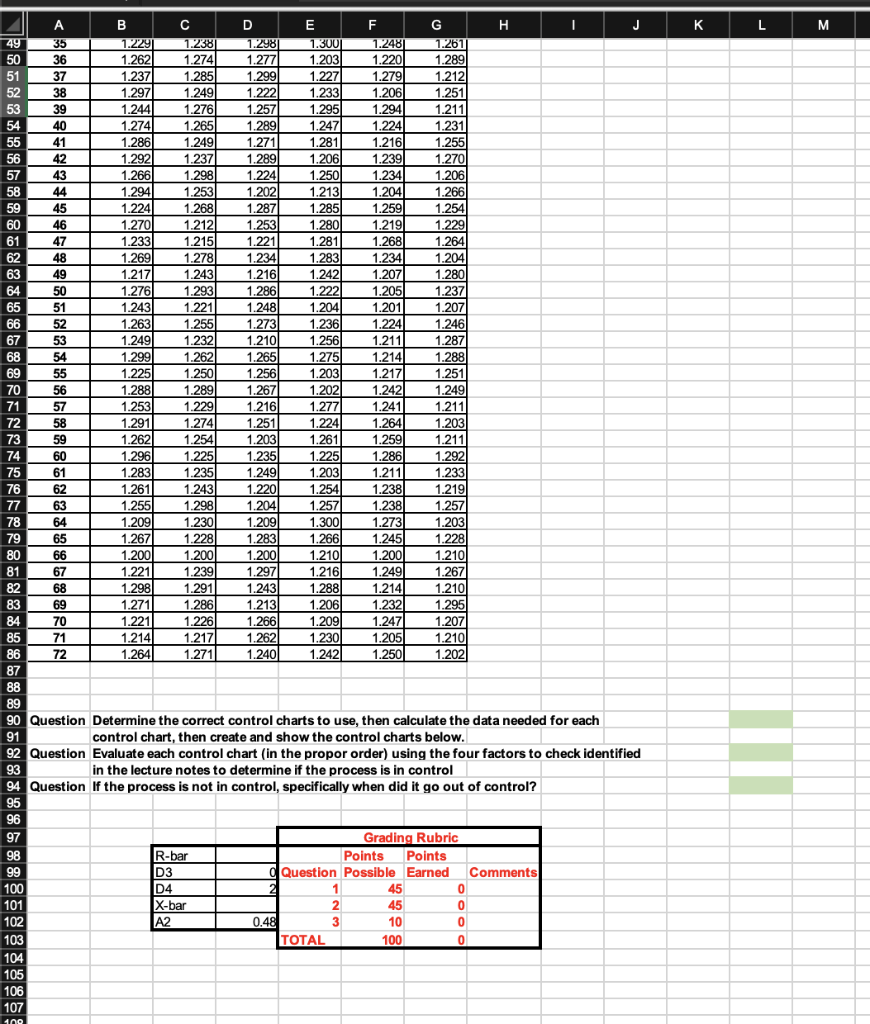
Question: 1 Quality Control Assignment 2 3 You must do the necessary calculations in the answer cells. Simply providing a number in the answer cell will

1 Quality Control Assignment 2 3 You must do the1 Quality Control Assignment 2 3 You must do the

1 Quality Control Assignment 2 3 You must do the necessary calculations in the answer cells. Simply providing a number in the answer cell will not receive any credit. 4 When look at the answer cell, I want to see a number, when I click on the cell I want to see the excel formula, for example, 5 if I asked you the sum of cells B5 through D5, this is what I want to see 7035.0 or 7035.0 6 1234 2345 3456 7 Be sure to show all of your work. 8 9 Problem 1: Use the data that is given below to answer the question that follow. 10 An automated sampling and quality control system experienced a systems failure. You job is to evaluate the data collected over the past 6 hours to detemine if the process being measured was in control the entire time. Six measurements were taken in each sample, and seventy two samples total were gathered. The measurements are the diameter of a hold that drilled in a piece of aluminum. 11 12 13 OBSERVATIONS WITHIN SAMPLES 14 Sample 1 2 3 4 4 5 6 15 1 1.224 1.260 1.272 1209 1.252 1.276 16 2 1.299 1.211 1.260 1.213 1.221 1.227 17 3 1.244 1.258 1.2161 1.244 1.282 1.271 18 4 4 1.220 1.277 1.252 1.281 1.229 1.206 19 5 1.204 1.254 1.219 1.296 1.241 1.276 20 6 1.293 1.234 1.256 1.257 1.210 1.236 21 7 7 1.227 1.239 1.249 1.260 1.242 1.215 22 8 1.271 1.201 1.296 1.243 1.205 1.216 23 9 1.2681 1.249 1.282 1.297 1.249) 1.259 24 10 1.276 1.285 1.282 1.276 1.247 1.284) 25 11 1.293 1.200 1.201 1.246 1.284 1.200 26 12 1.230 1.271 1287 1.256 1.232 1.294 27 13 1.217 1.293 1.254 1.231 1.246 1.279 28 14 1.289 1.267 1.2201 1.238 1.254 1.267 29 15 1.259 1.204 1.271 1.213 1.209 1.299 30 16 1.228 1.226 1.261 1.244 1.265 1.240 31 17 1.263 1.278 1.227 1.275 1.264 1.247 32 18 1.243 1.256 1.298 1.277 1.228 1.234 33 19 1.258 1.265 1.230 1.283 1.253 1.291 34 20 1.260 1.225 1.218 1.217 1.219 1.286 35 21 1.220 1.216 1.273 1.247 1.280 1.22 36 22 1.242 1.238 1.256 1.295 1.251 1.201 37 23 1.264 1.241 1.276 1.223 1.270 1.280 38 24 1.207 1.228 1.228 1.240 1.257 1.202 39 25 1.293 1.293 1201 1.261 1.263 1.222 40 26 1.210 1.270 1.283 1.285 1.256 1.280 41 27 1.297 1.209 1.260 1.215 1.227 1.217 42 28 1.215 1.266 1.235 1.204 1.235 1.248 43 29 1.211 1.218 1.245 1.287 1.253 1.283 44 30 1.267 1.274 1.260 1.253 1.210 1.250 45 31 1.241 1.244 1.203 1.244 1.298 1.226 46 32 1.278 1.270 1.2341 1.246 1.215 1.2151 47 33 1.278 1.259 1.233 1.290 1.232 1.285 48 34 1.292 1.201 1.292 1.285 1.250 1.221 49 35 1.229 1.238 1.298 1.300 1.248 1.261 50 36 1.262 1.274 1.277 1.203 1.220 1.289 51 37 1.237 1.285 1.299 1.227 1.279 1.212 52 38 1.297 1.249 1.222 1.233 1.206 1.251 53 39 1.244 1.276 1.257 1.295 1.294 1.211 54 40 1.2741 1.2651 1.2891 1.2471 1.2241 1.2311 Sheet1 Sheet2 Sheet3 + L M 1.234 1.213 A B D D E F G H I J 49 35 1.2291 1.238 1.2981 1.300 1.2481 1.261 50 36 1.262 1.274) 1.277 1.2031 1.220 1.289 51 37 1.237 1.285 1.299 1.227 1.279 1.212 52 38 1.297 1.249 1.222 1.233 1.206 1.251 53 39 1.244 1.276 1.257 1.295 1.294 1.211 54 40 1.274 1.265 1.289 1.2471 1.224 1.231 55 41 1.286 1.200 1.249 1.271 1.281 1.216 1.255 56 42 1.292 1.237 1.289 1.206 1.239 1.270 57 43 1.266 1.298 1.224 1.224 1.250 1.206 58 30 4+ 44 1.294 1.234 1.253 1.2021 1.204 1.266 59 09 45 1.224 1.268 1.287 1.285) 1.259 1.254 60 46 1.270 1.2121 1.253 1.280 1.219) 1.229 61 64 47 1.233 1.215 1.221 1.281 1.268 1.264 9 62 48 1.269 1.278) 1.234 1.283 1.2341 1.204 63 49 4247 1.217 1.243 1.2161 1.242 1.207 1.280 1104 400 64 12 50 4200 100 1.276 1.293 1.286 1.222 1.205 1.237 2018 2001 65 51 1.243 1.221 4240 1.248 1.204 2005 1.201 1.207 66 52 1.263 1.255 1.273 1.236 1.224 1.246 67 53 1.249 1.232 1.210 1.256 1.211 1.287 68 54 1.299 1.262 1.265 1.275 1.214 1.288 69 55 1.225 1.250 1.256 1.203 1.217 1.251 70 56 1.288 1.289 1.267 1.202 1.242 1.249 71 57 1.253 1.229 1.216 1.277 1.241 1.211 72 58 1.291 1.274 1.251 1.224 1.264) 1.203 73 59 1.262 1.254 1.2031 1.261 1.259 1.211 74 60 1.296 1.225 1.235 1.225) 1.286 1.292 75 61 1.283 1.235 1.249 1.203 1.211 1.233 76 62 1.261 1.243 1.220 1.254 1.238 1.219 77 63 1.255 1.298 1.204 1.257 1.238 1.257 78 64 1.209 1.230 1.209 1.300 1.273 1.203 79 65 1.267 1.201 1.228 1.283 1.266 1.245 1.228 80 66 00 1.200 1.200 1.200 1.200 1.210 1.200 1.210 ol 81 67 1.221 1.239 1.221 1.297 1.291 1.216 1.249 1.267 82 68 1.298 1.291 1.243 1.288 1.210 69 1.271 1.286 1.213 1.206 1.232 1.295 SA 84 70 1.221 1.226 1.266 1.209 1.247 1.207 85 71 1.214 1.217 1.2621 1.230 1.205 1.210 86 72 1.264) 1.271 1.240 1.242 1.250 1.202 87 88 89 90 Question Determine the correct control charts to use, then calculate the data needed for each 91 control chart, then create and show the control charts below. 92 Question Evaluate each control chart in the propor order) using the four factors to check identified 93 in the lecture notes to determine if the process is in control 94 Question If the process is not in control, specifically when did it go out of control? 95 96 97 Grading Rubric 98 R-bar Points Points 99 D3 d Question Possible Earned Comments 100 D4 2 1 45 0 0 101 X-bar 2 45 0 0 102 A2 0.48 3 10 0 103 TOTAL 100 0 104 105 106 107 1.214 83 100

Step by Step Solution

There are 3 Steps involved in it

1 Expert Approved Answer
Step: 1 Unlock blur-text-image
Question Has Been Solved by an Expert!

Get step-by-step solutions from verified subject matter experts

Step: 2 Unlock
Step: 3 Unlock

Students Have Also Explored These Related General Management Questions!