

Question: 1 Question: 1. Which graphs can be made with the data names provided below? The data names that can be used: DEMAND INV ON HAND
1 Question:
1. Which graphs can be made with the data names provided below?
- The data names that can be used:
- DEMAND
- INV ON HAND
- AVAILABLE TO SELL
- SALES
- LOST DEMAND
- INV ON ORDER (BEFORE ORDERING)
- TOTAL INV (BEFORE ORDERING)
- ORDERS, RECEIPTS
- INV ON ORDER (AFTER ORDERING)
- TOTAL (AFTER ORDERING)
COMBINE ANY OF THE DATA NAMES LISTED ABOVE TO MAKE A GRAPH WITH A CHART THAT MAKES SINCE.
NO PIE CHARTS
- It's all one question with multiple answers, by multiple answers I mean multiple charts with different data names that could be shown.
This image can be helpful;:
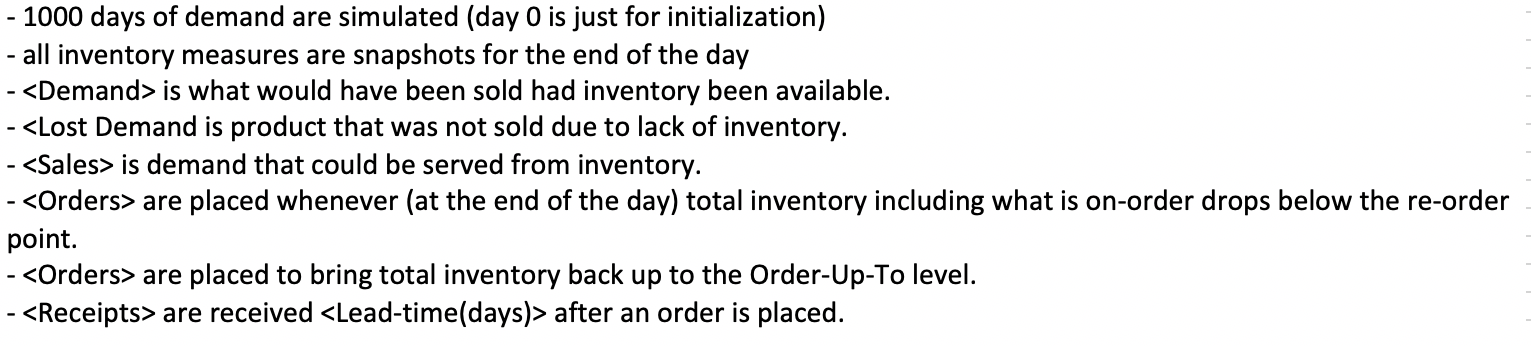
- 1000 days of demand are simulated (day 0 is just for initialization) - all inventory measures are snapshots for the end of the day -
Step by Step Solution
There are 3 Steps involved in it

Get step-by-step solutions from verified subject matter experts