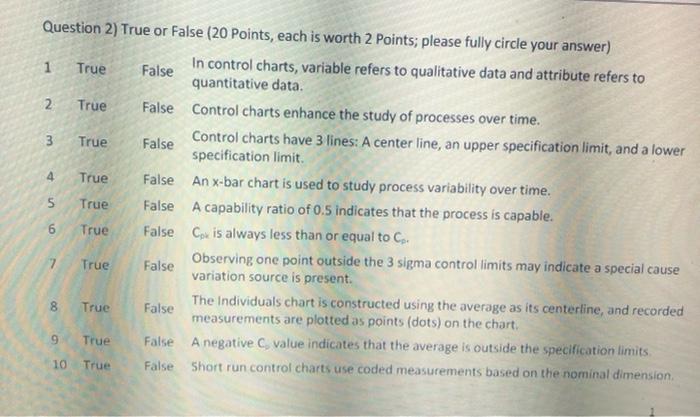
Question: 1 Question 2) True or False (20 Points, each is worth 2 Points; please fully circle your answer) True False In control charts, variable refers

1 Question 2) True or False (20 Points, each is
1 Question 2) True or False (20 Points, each is worth 2 Points; please fully circle your answer) True False In control charts, variable refers to qualitative data and attribute refers to quantitative data. 2 True False Control charts enhance the study of processes over time. 3 True False Control charts have 3 lines: A center line, an upper specification limit, and a lower specification limit 4 True False An x-bar chart is used to study process variability over time. 5 True False A capability ratio of 0.5 indicates that the process is capable. 6 True False Cox is always less than or equal to Co. Observing one point outside the 3 sigma control limts may indicate a special cause 7 True False variation source is present. The Individuals chart is constructed using the average as its centerline, and recorded 8 True False measurements are plotted as points (dots) on the chart, True False A negative value indicates that the average is outside the specification limits 10 True False Short run control charts use coded measurements based on the nominal dimension CO 9

Step by Step Solution

There are 3 Steps involved in it

1 Expert Approved Answer
Step: 1 Unlock blur-text-image
Question Has Been Solved by an Expert!

Get step-by-step solutions from verified subject matter experts

Step: 2 Unlock
Step: 3 Unlock

Students Have Also Explored These Related General Management Questions!