

Question: --/1 Question 3 View Policies Current Attempt in Progress Cullumber Company has these comparative balance sheet data: CULLUMBER COMPANY Balance Sheets December 31 2017 2016
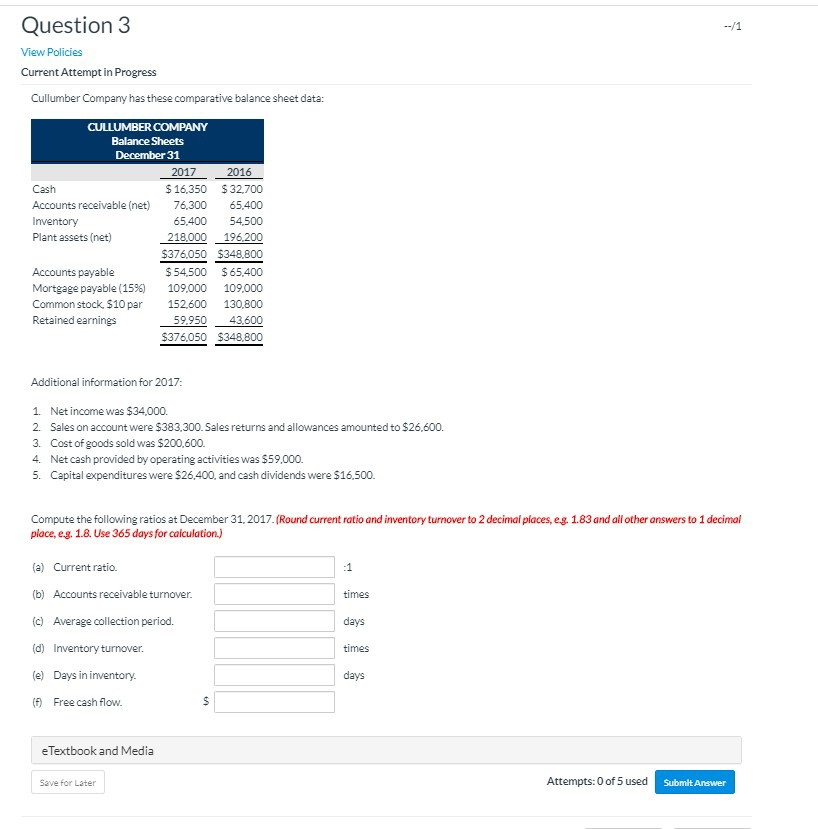
--/1 Question 3 View Policies Current Attempt in Progress Cullumber Company has these comparative balance sheet data: CULLUMBER COMPANY Balance Sheets December 31 2017 2016 Cash $ 16,350 $ 32,700 Accounts receivable (net) 76,300 65.400 Inventory 65.400 54.500 Plant assets (net) 218,000 196,200 $376,050 $348,800 Accounts payable $ 54,500 $ 65,400 Mortgage payable (1596) 109,000 109,000 Common stock $10 per 152,600 130,800 Retained earnings 59,950 43,600 $376,050 $348.800 Additional information for 2017: 1. Net income was $34.000. 2. Sales on account were $383,300. Sales returns and allowances amounted to $26,600. 3. Cost of goods sold was $200.600. 4. Net cash provided by operating activities was $59.000. 5. Capital expenditures were $26.400, and cash dividends were $16,500. Compute the following ratios at December 31, 2017. (Round current ratio and inventory turnover to 2 decimal places, eg. 1.83 and all other answers to 1 decimal place, eg. 1.8. Use 365 days for calculation.) (a) Current ratio. -1 times (b) Accounts receivable turnover. (c) Average collection period. days (d) Inventory turnover. times days (e) Days in inventory. ( Free cash flow. $ eTextbook and Media Save for Later Attempts:0 of 5 used Submit
Step by Step Solution
There are 3 Steps involved in it

Get step-by-step solutions from verified subject matter experts