

Question: 1. Read the attached short abstract. Based on these data, please: a). Explain whether the demands for alcoholic beverages are elastic or inelastic. what would
1. Read the attached short abstract. Based on these data, please:
a). Explain whether the demands for alcoholic beverages are elastic or inelastic. what would happen to the sales of beer, wine, and spirits, respectively, if their own prices increased by 10%?
b). If the federal government imposes a specific excise tax on all alcoholic beverages (beer, wine, spirits), who will likely bear the burden of a larger proportion of the tax, consumers or producers? why? Explain whether or not this tax will reduce total social welfare (the sum of consumer and producer surplus).
c). After imposing this tax, what would happen to the sale of cigarettes?

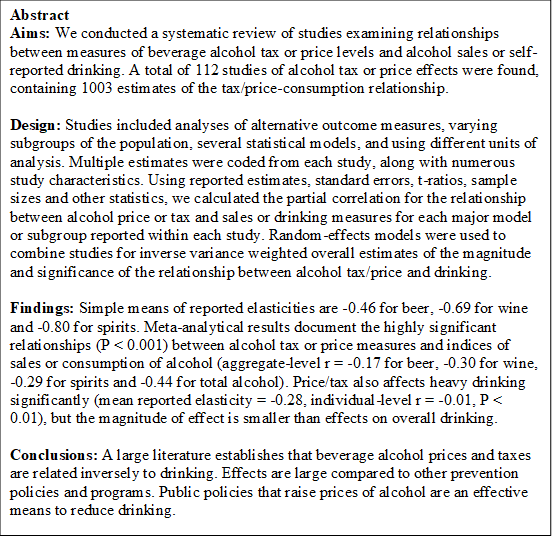
Abstract Aims: We conducted a systematic review of studies examining relationships between measures of beverage alcohol tax or price levels and alcohol sales or self- reported drinking. A total of 112 studies of alcohol tax or price effects were found, containing 1003 estimates of the tax/price-consumption relationship. Design: Studies included analyses of alternative outcome measures, varying subgroups of the population, several statistical models, and using different units of analysis. Multiple estimates were coded from each study, along with numerous study characteristics. Using reported estimates, standard errors, t-ratios, sample sizes and other statistics, we calculated the partial correlation for the relationship between alcohol price or tax and sales or drinking measures for each major model or subgroup reported within each study. Random-effects models were used to combine studies for inverse variance weighted overall estimates of the magnitude and significance of the relationship between alcohol tax/price and drinking. Findings: Simple means of reported elasticities are -0.46 for beer, -0.69 for wine and -0.80 for spirits. Meta-analytical results document the highly significant relationships (P
Step by Step Solution
There are 3 Steps involved in it

Get step-by-step solutions from verified subject matter experts