

Question: 1 . Read the data from the CSV file into a DataFrame and display the first five rows 2 . Create the following plot with
Read the data from the CSV file into a DataFrame and display the first five rows
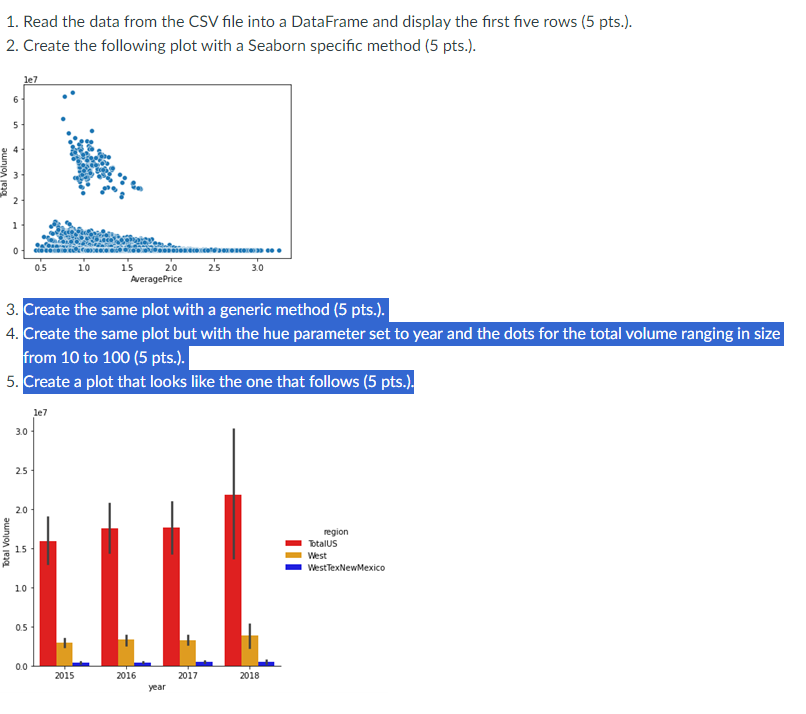
Create the following plot with a Seaborn specific method
Create the same plot with a generic method
Create the same plot but with the hue parameter set to year and the dots for the total volume ranging in size
from to
Create a plot that looks like the one that follows
Step by Step Solution
There are 3 Steps involved in it
1 Expert Approved Answer
Step: 1 Unlock

Question Has Been Solved by an Expert!
Get step-by-step solutions from verified subject matter experts
Step: 2 Unlock
Step: 3 Unlock