

Question: 1. Read the New York Blower Fan Laws Document. Pay special attention to the Pressure and Velocity, and the Fan Curve and System Curve sections.
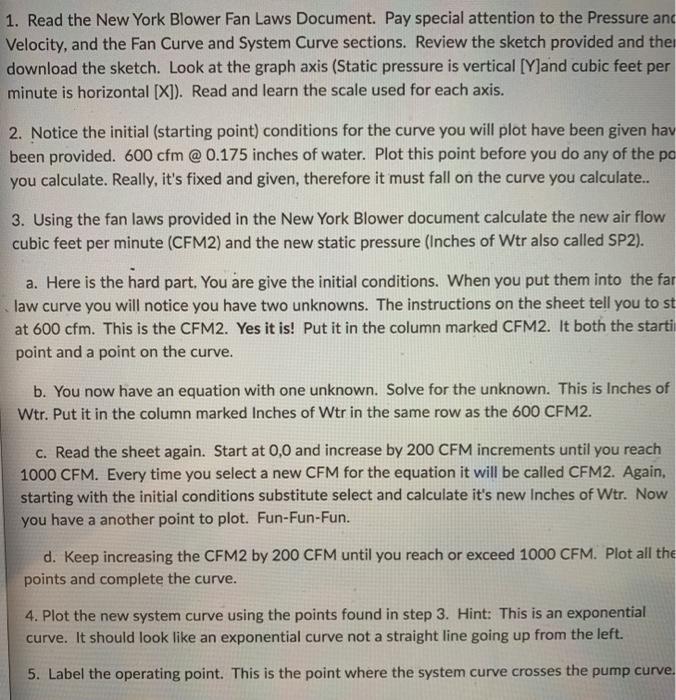
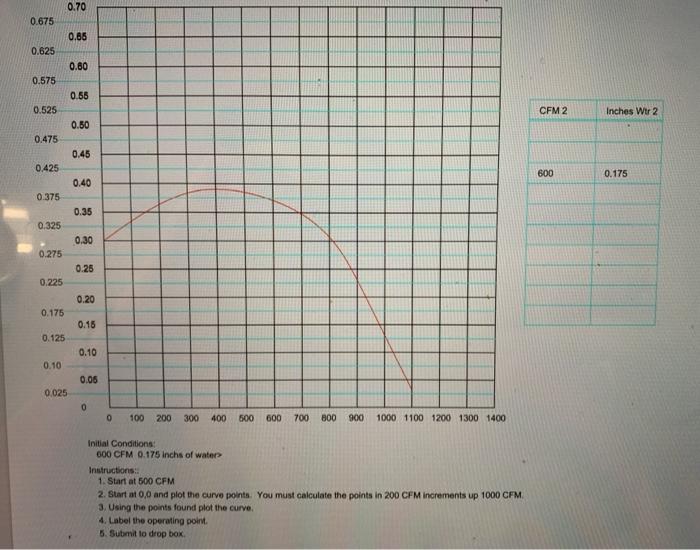
1. Read the New York Blower Fan Laws Document. Pay special attention to the Pressure and Velocity, and the Fan Curve and System Curve sections. Review the sketch provided and the download the sketch. Look at the graph axis (Static pressure is vertical [Y]and cubic feet per minute is horizontal [X]). Read and learn the scale used for each axis. 2. Notice the initial (starting point) conditions for the curve you will plot have been given hav been provided. 600 cfm @ 0.175 inches of water. Plot this point before you do any of the po you calculate. Really, it's fixed and given, therefore it must fall on the curve you calculate.. 3. Using the fan laws provided in the New York Blower document calculate the new air flow cubic feet per minute (CFM2) and the new static pressure (Inches of Wtr also called SP2). a. Here is the hard part. You are give the initial conditions. When you put them into the far law curve you will notice you have two unknowns. The instructions on the sheet tell you to st at 600 cfm. This is the CFM2. Yes it is! Put it in the column marked CFM2. It both the starti point and a point on the curve. b. You now have an equation with one unknown. Solve for the unknown. This is Inches of Wtr. Put it in the column marked Inches of Wtr in the same row as the 600 CFM2. c. Read the sheet again. Start at 0,0 and increase by 200 CFM increments until you reach 1000 CFM. Every time you select a new CFM for the equation it will be called CFM2. Again, starting with the initial conditions substitute select and calculate it's new Inches of Wtr. Now you have a another point to plot. Fun-Fun-Fun. d. Keep increasing the CFM2 by 200 CFM until you reach or exceed 1000 CFM. Plot all the points and complete the curve. 4. Plot the new system curve using the points found in step 3. Hint: This is an exponential curve. It should look like an exponential curve not a straight line going up from the left. 5. Label the operating point. This is the point where the system curve crosses the pump curve. 0.70 0.675 0.86 0.625 0.80 0.575 0.66 0.525 CFM 2 Inches Wtr 2 0.50 0.475 0.45 0.425 600 0.175 0.40 0.375 0.35 0.325 0.30 0.275 0.25 0.225 0.20 0.175 0.18 0.125 0.10 0.10 0.06 0.025 0 100 200 300 400 500 600 700 800 900 1000 1100 1200 1300 1400 Initial Conditions: 000 CFM 0.175 inchs of water Instructions: 1. Start at 500 CFM 2. Start at 0,0 and plot the curve points. You must calculate the points in 200 CFM increments up 1000 CFM 3. Using the points found plot the curve 4. Label the operating point 5. Submit to drop box 1. Read the New York Blower Fan Laws Document. Pay special attention to the Pressure and Velocity, and the Fan Curve and System Curve sections. Review the sketch provided and the download the sketch. Look at the graph axis (Static pressure is vertical [Y]and cubic feet per minute is horizontal [X]). Read and learn the scale used for each axis. 2. Notice the initial (starting point) conditions for the curve you will plot have been given hav been provided. 600 cfm @ 0.175 inches of water. Plot this point before you do any of the po you calculate. Really, it's fixed and given, therefore it must fall on the curve you calculate.. 3. Using the fan laws provided in the New York Blower document calculate the new air flow cubic feet per minute (CFM2) and the new static pressure (Inches of Wtr also called SP2). a. Here is the hard part. You are give the initial conditions. When you put them into the far law curve you will notice you have two unknowns. The instructions on the sheet tell you to st at 600 cfm. This is the CFM2. Yes it is! Put it in the column marked CFM2. It both the starti point and a point on the curve. b. You now have an equation with one unknown. Solve for the unknown. This is Inches of Wtr. Put it in the column marked Inches of Wtr in the same row as the 600 CFM2. c. Read the sheet again. Start at 0,0 and increase by 200 CFM increments until you reach 1000 CFM. Every time you select a new CFM for the equation it will be called CFM2. Again, starting with the initial conditions substitute select and calculate it's new Inches of Wtr. Now you have a another point to plot. Fun-Fun-Fun. d. Keep increasing the CFM2 by 200 CFM until you reach or exceed 1000 CFM. Plot all the points and complete the curve. 4. Plot the new system curve using the points found in step 3. Hint: This is an exponential curve. It should look like an exponential curve not a straight line going up from the left. 5. Label the operating point. This is the point where the system curve crosses the pump curve. 0.70 0.675 0.86 0.625 0.80 0.575 0.66 0.525 CFM 2 Inches Wtr 2 0.50 0.475 0.45 0.425 600 0.175 0.40 0.375 0.35 0.325 0.30 0.275 0.25 0.225 0.20 0.175 0.18 0.125 0.10 0.10 0.06 0.025 0 100 200 300 400 500 600 700 800 900 1000 1100 1200 1300 1400 Initial Conditions: 000 CFM 0.175 inchs of water Instructions: 1. Start at 500 CFM 2. Start at 0,0 and plot the curve points. You must calculate the points in 200 CFM increments up 1000 CFM 3. Using the points found plot the curve 4. Label the operating point 5. Submit to drop box
Step by Step Solution
There are 3 Steps involved in it

Get step-by-step solutions from verified subject matter experts