

Question: 1. Recreate the image below on a new worksheet 2. For each year calculate the net profit margin in% 3. Calculate the Compound Annual Growth
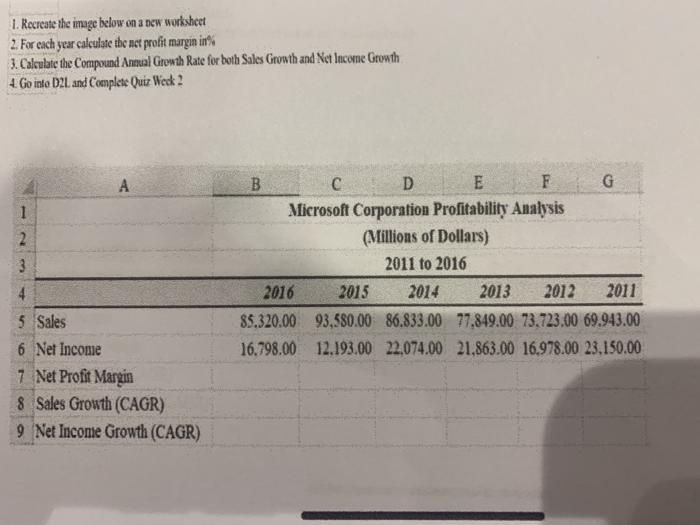
1. Recreate the image below on a new worksheet 2. For each year calculate the net profit margin in% 3. Calculate the Compound Annual Growth Rate for both Sales Growth and Net Income Growth 4. Go into D21. and Complete Quiz Week 2 1 2 3 4 B D E F G Microsoft Corporation Profitability Analysis (Millions of Dollars) 2011 to 2016 2016 2015 2014 2013 2011 85.320.00 93,580.00 86.833.00 77.849.00 73.723.00 69.943.00 16.798.00 12.193.00 22.074.00 21,863.00 16.978.00 23.150.00 2012 5 Sales 6 Net Income 7 Net Profit Margin 8 Sales Growth (CAGR) 9 Net Incone Growth (CAGR)
Step by Step Solution
There are 3 Steps involved in it
1 Expert Approved Answer
Step: 1 Unlock

Question Has Been Solved by an Expert!
Get step-by-step solutions from verified subject matter experts
Step: 2 Unlock
Step: 3 Unlock